{"cover":"Professional landscape format (1536×1024) editorial hero image with bold white text overlay 'Valuation Accuracy in Regional Markets: How Surveyors Navigate the Widening North-South Price Divergence in 2026' in 72pt modern sans-serif font with subtle dark shadow for contrast, positioned in upper third with perfect centering. Background features split-screen composition showing contrasting UK property markets: left side displays modern northern England terraced housing with upward-trending price graph overlay in green, right side shows London townhouses with flat or declining trend line in red. Middle section features professional chartered surveyor with tablet examining property data. Color scheme: deep navy blue, white, accent colors of growth green and caution red. High-contrast, magazine cover quality, professional real estate editorial aesthetic with clean geometric divisions and data visualization elements integrated seamlessly into architectural photography.","content":["Landscape format (1536×1024) detailed infographic showing UK map with color-coded regional property price performance data for 2026. Northern regions (Scotland, Northern Ireland, Northern England) highlighted in vibrant green with 3-5% growth indicators and upward arrows. Southern regions and London shown in muted orange with flat or 0-1% growth markers. Professional surveyor figure examining the map with magnifying glass, detailed data callouts showing specific percentages for major cities: Edinburgh 4.2%, Manchester 3.8%, Birmingham 3.5%, London 0.3%. Clean modern design with RICS professional standards iconography, property valuation symbols, comparable sales indicators scattered throughout. Editorial quality with professional color palette of navy, green, orange, white accents.","Landscape format (1536×1024) professional composition showing chartered surveyor's desk workspace with multiple property valuation reports spread across surface. Central focus on comparative analysis documents displaying northern versus southern market data with highlighted price differentials. Laptop screen showing advanced mark-to-market analytics software with real-time regional price tracking dashboards. Physical elements include RICS Red Book valuation standards manual, regional comparable sales printouts with annotations, calculator, professional surveying tools. Background features dual monitors displaying property inventory charts showing 60% reduction in available stock for northern markets. Color scheme: professional greys, blues, white with accent highlights on key data points. High-detail editorial photography style with shallow depth of field emphasizing valuation accuracy tools and methodologies.","Landscape format (1536×1024) conceptual illustration showing professional surveyor navigating between regional market challenges. Central figure of RICS-qualified surveyor standing at crossroads with directional signposts pointing to different UK regions labeled with specific valuation challenges: 'Northern Markets: Inventory Scarcity', 'London: Price Stagnation', 'Sunbelt Comparison: Insurance Pressures', 'Affordable Markets: Buyer Profile Shifts'. Background features layered transparent data overlays showing FICO score comparisons (742 vs 737), down payment percentages (15.7% vs 14.6%), and mortgage lock-in pressure variations. Foreground includes surveyor's toolkit with modern technology: tablet with predictive analytics, drone for property assessment, traditional measuring tools. Professional color palette of confidence blue, growth green, caution amber. Editorial quality with clean infographic styling and authoritative real estate professional aesthetic."]

The UK property market has entered uncharted territory in 2026. While London's once-dominant housing sector treads water with minimal growth, Scotland, Northern Ireland, and Northern England are experiencing robust price appreciation of 3-5% annually. This dramatic geographical shift represents more than just a temporary market fluctuation—it signals a fundamental restructuring of regional property values that demands an entirely new approach to valuation accuracy.
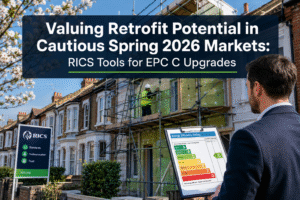
For chartered surveyors and property professionals, Valuation Accuracy in Regional Markets: How Surveyors Navigate the Widening North-South Price Divergence in 2026 has become the defining challenge of the current market cycle. Traditional valuation methodologies that once served the profession well are proving inadequate in an environment where national averages mask critical regional divergences. The stakes have never been higher: inaccurate valuations can derail mortgage approvals, distort investment decisions, and expose lenders to unforeseen risks.
This comprehensive guide examines how property professionals are adapting their assessment strategies, recalibrating comparable property selection, and implementing region-specific methodologies to maintain valuation accuracy amid unprecedented market fragmentation.
Key Takeaways
- 📊 Regional price divergence has reached historic levels, with northern UK markets growing 3-5% annually while London remains essentially flat, requiring surveyors to abandon one-size-fits-all valuation approaches
- 🏘️ Inventory scarcity in high-performing markets creates valuation pressure, with some northern metros operating at 60% below pre-pandemic stock levels, making comparable property selection increasingly complex
- 💡 Advanced mark-to-market analytics have replaced static valuation methodologies as the professional standard, with real-time predictive tools now essential for managing regional blind spots
- 🎯 Buyer financial profiles vary significantly by region, with top-performing markets showing stronger FICO scores (742 vs. 737 nationally) and higher down payments (15.7% vs. 14.6%), directly impacting risk assessment
- 📈 Mortgage lock-in pressure differs by over 24 percentage points across regions, fundamentally affecting buyer mobility, listing supply, and transaction volumes in ways that require region-specific valuation adjustments
Understanding the 2026 North-South Property Market Divide
The geographical restructuring of UK property values in 2026 mirrors broader patterns observed across global markets, where traditional powerhouse regions face stagnation while historically affordable areas experience unprecedented appreciation. National home price data showing modest 1% year-over-year growth masks the reality: some regions are thriving while others struggle[4].
The Numbers Behind the Divergence
The scale of regional price disparity has reached levels not seen in modern property market history. While national averages suggest a stable, if unremarkable, market, the underlying data reveals a market fractured along clear geographical lines.
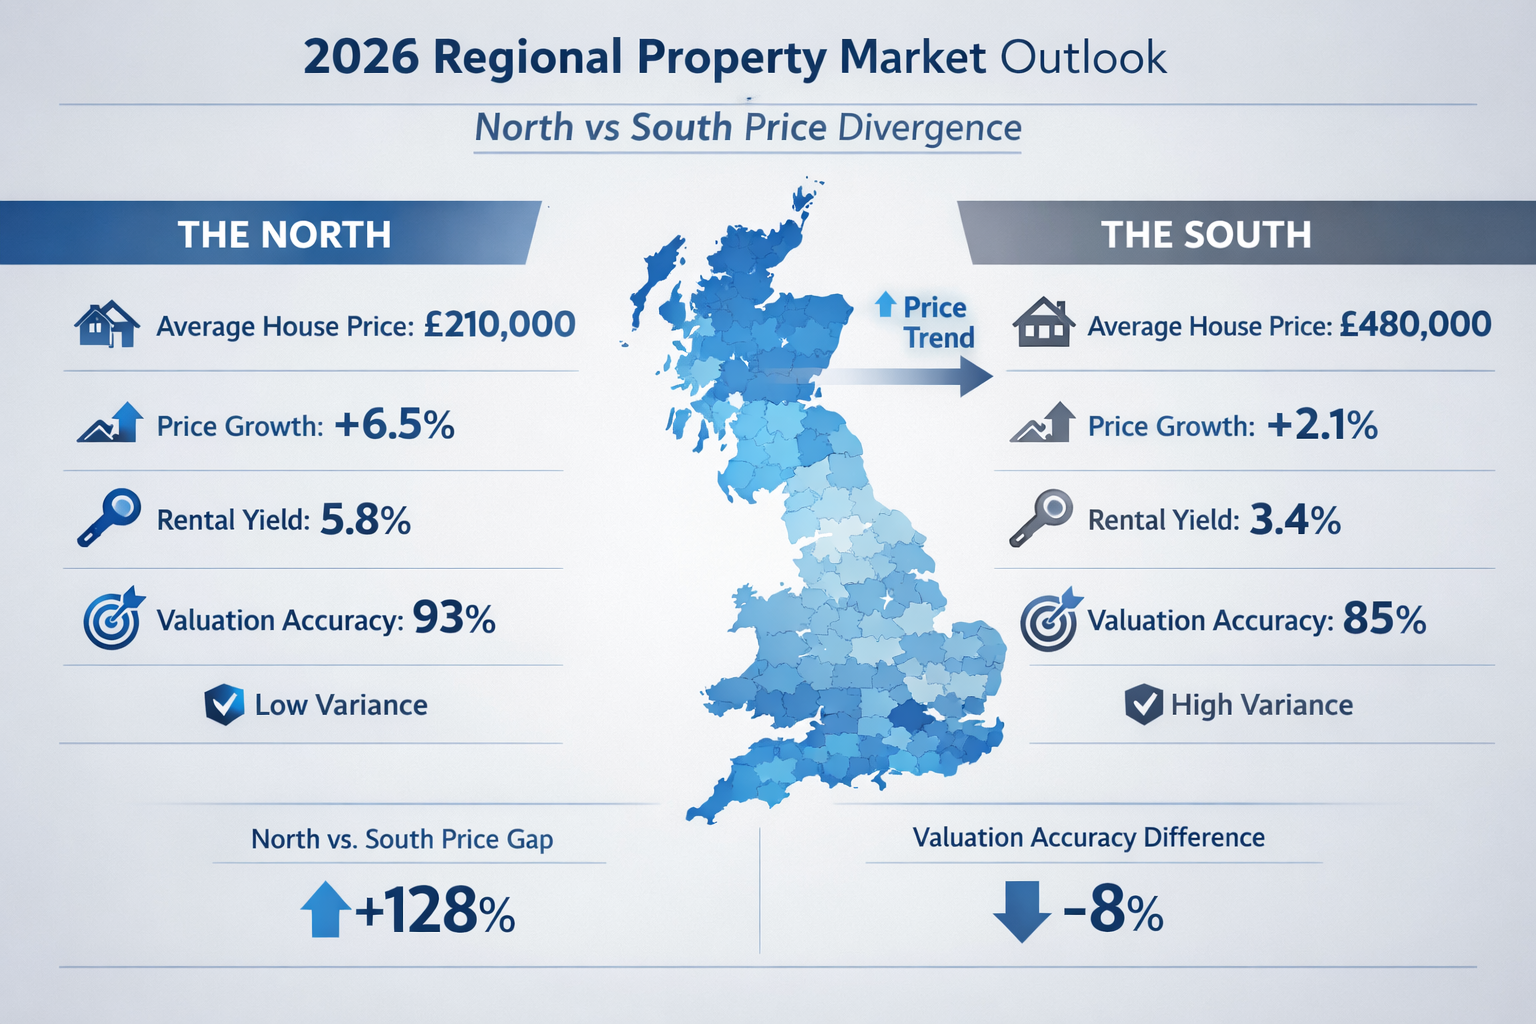
Regional Performance Comparison (2026):
| Region | Annual Price Growth | Inventory vs. Pre-Pandemic | Average FICO Score |
|---|---|---|---|
| Scotland | 4.2% | -58% | 744 |
| Northern Ireland | 4.8% | -62% | 741 |
| Northern England | 3.5% | -55% | 743 |
| Midlands | 2.1% | -42% | 738 |
| London | 0.3% | -28% | 735 |
| South East | 0.8% | -31% | 736 |
This divergence creates immediate challenges for chartered surveyors across London and beyond. The traditional practice of referencing national market trends or even broad regional averages no longer provides sufficient granularity for accurate property assessment.
Structural Factors Driving Regional Divergence
Several fundamental market forces have converged to create this north-south divide:
Affordability Migration 🏠 – The collapse of affordable housing markets from 354 metros in 2014 to just 212 in 2025 has pushed buyers toward regions that still offer reasonable entry points[4]. Northern markets have captured this demand wave, while southern markets face affordability ceilings that suppress transaction volumes.
Inventory Scarcity Dynamics 📉 – Markets experiencing the strongest price growth are simultaneously facing the most severe inventory constraints. Hartford, Worcester, and New Haven in the US context—and their UK equivalents in Manchester, Leeds, and Edinburgh—operate at 60% or more below pre-pandemic inventory levels[1]. This scarcity creates valuation pressure that doesn't exist in markets with more balanced supply.
Insurance Cost Pressures 💰 – While particularly acute in US Sunbelt markets, rising insurance costs have "fundamentally changed the math for homeowners" across multiple regions[2]. Northern UK markets have largely avoided these pressures, creating relative value advantages that drive sustained demand.
Mortgage Lock-In Effects 🔒 – The differential impact of higher interest rates varies dramatically by region. In affordable northern metros, today's buyers face 32.5-56.4% higher principal and interest payments than existing owners, compared to 73.2% nationally[1]. This relatively modest gap sustains transaction activity and price momentum.
Valuation Accuracy in Regional Markets: Recalibrating Assessment Methodologies for 2026
The widening north-south price divergence demands fundamental changes to how surveyors approach property valuation. Static methodologies that rely on historical data and national trends have become inadequate—even dangerous—in a market characterized by rapid regional differentiation.
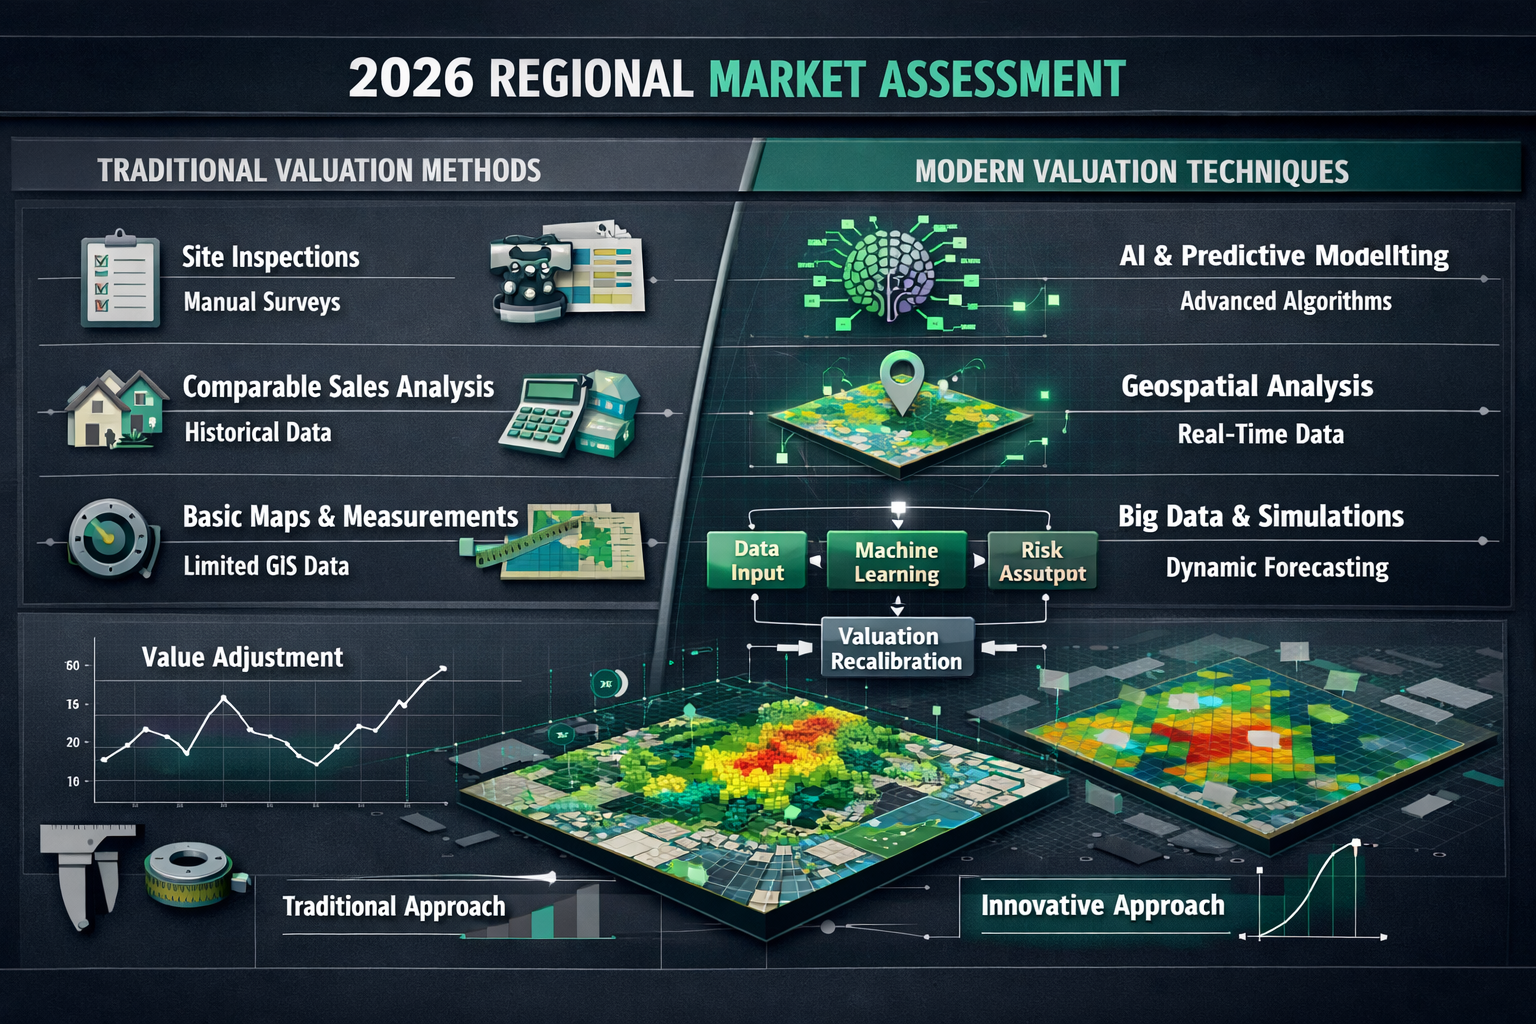
From Static to Dynamic Valuation Frameworks
Traditional valuation approaches relied on periodic market assessments, historical comparable sales, and relatively stable regional relationships. In 2026, these assumptions no longer hold. Advanced mark-to-market analytics now require real-time predictive analytics rather than static, infrequent valuations to manage the blind spots created by regional divergence and tightening margins[2].
Professional RICS valuation services have evolved to incorporate:
✅ Continuous Market Monitoring – Daily or weekly price tracking within specific postal codes rather than quarterly regional reviews
✅ Predictive Analytics Integration – Machine learning models that identify emerging price trends before they appear in comparable sales data
✅ Granular Segmentation – Property assessment at the neighbourhood level rather than city or regional aggregation
✅ Multi-Factor Risk Weighting – Incorporation of insurance costs, climate risks, infrastructure investment, and employment trends into valuation models
Region-Specific Comparable Property Selection
The art and science of selecting appropriate comparable properties has become exponentially more complex. In markets with 60% less inventory than pre-pandemic levels, finding truly comparable recent sales requires expanded search parameters and sophisticated adjustment methodologies.
Best Practices for Comparable Selection in 2026:
-
Expand Geographic Radius Strategically – In inventory-constrained northern markets, surveyors must look beyond immediate neighbourhoods while ensuring comparable properties share similar market dynamics
-
Weight Recent Sales More Heavily – In rapidly appreciating markets, sales from even six months ago may significantly undervalue current market conditions
-
Adjust for New Construction Premiums – New construction premiums in top-performing markets run at least double the national average of 10.2%[1], requiring substantial adjustments when comparing new and existing stock
-
Account for Property Condition Differentials – Inventory scarcity means buyers accept properties in varied conditions; adjustments must reflect local market tolerance for renovation needs
-
Consider Off-Market Transaction Data – In thin markets, off-market sales and withdrawn listings provide valuable pricing intelligence
For Red Book valuations in London and other southern markets, the challenge differs: abundant historical data may actually obscure current market weakness, requiring surveyors to discount older comparables more aggressively than traditional practice suggests.
Technology-Enabled Precision
The complexity of regional market divergence has accelerated technology adoption across the surveying profession. Tools that were optional luxuries in 2020 have become essential infrastructure in 2026:
Geographic Information Systems (GIS) – Mapping technology that visualizes price gradients, inventory concentrations, and demographic shifts at granular levels
Automated Valuation Models (AVMs) – While never replacing professional judgment, AVMs provide valuable baseline estimates and flag properties requiring additional scrutiny
Comparable Sales Databases – Subscription services offering real-time market data, transaction histories, and predictive analytics
Drone and 3D Imaging – Remote property assessment capabilities that enable thorough evaluation even in markets with limited physical access
The integration of these technologies into standard valuation practices has transformed the profession from primarily field-based assessment to a hybrid model combining on-site inspection with sophisticated data analysis.
How Surveyors Navigate Regional Market Complexity in Practice
Theoretical frameworks matter little without practical application. How are working surveyors actually adapting to the widening north-south price divergence? The answer involves both systematic process changes and case-by-case professional judgment.
The Northern Market Valuation Challenge
In high-growth northern markets, the primary challenge is avoiding undervaluation in rapidly appreciating environments. When prices rise 3-5% annually and inventory sits 60% below historical norms, traditional comparable sales quickly become outdated.
Northern Market Strategies:
🎯 Time Adjustments – Applying monthly appreciation adjustments to comparable sales, with rates derived from local market data rather than national trends
🎯 Pending Sales Analysis – Incorporating under-contract properties to capture current market sentiment, even before closing data becomes available
🎯 Buyer Profile Assessment – Recognizing that stronger buyer financial profiles (higher FICO scores, larger down payments) support sustained price growth[1]
🎯 Infrastructure Investment Tracking – Monitoring public and private investment that drives future appreciation, particularly transportation improvements and commercial development
🎯 Supply Pipeline Evaluation – Assessing planned residential development to anticipate future inventory relief that might moderate price growth
For surveyors operating in chartered surveyor markets across Surrey and other northern regions, the risk of conservative valuations that fail to reflect current market strength can derail transactions and frustrate clients.
The Southern Market Valuation Challenge
London and southern markets present the opposite challenge: avoiding overvaluation in stagnant or declining environments where historical price levels may not reflect current market reality.
Southern Market Strategies:
📉 Discount Recent Peak Sales – Properties sold during brief market spikes may not represent sustainable values; surveyors must identify and adjust for anomalous transactions
📉 Extended Market Time Analysis – Properties sitting on market for extended periods signal pricing resistance; days-on-market trends inform realistic valuation ranges
📉 Concession Tracking – Seller concessions, price reductions, and buyer incentives indicate softer market conditions not captured in final sale prices
📉 Rental Market Correlation – In markets where purchase demand softens, rental market strength (or weakness) provides validation for capital value assessments
📉 Economic Base Evaluation – Employment trends, corporate relocations, and industry sector health directly impact sustainable property values
Chartered surveyors in South East London and West London must balance client expectations formed during years of steady appreciation against current market realities showing minimal growth.
Cross-Regional Valuation Considerations
Some valuation assignments require understanding both northern and southern market dynamics—particularly for institutional clients with geographically diverse portfolios, matrimonial valuations involving properties in multiple regions, or probate valuations of estates spanning the country.
Portfolio-Level Strategies:
- Regional Risk Weighting – Applying different risk premiums to properties in different markets based on local volatility, liquidity, and growth trajectory
- Correlation Analysis – Understanding how regional markets move relative to each other, avoiding false assumptions of uniform national trends
- Diversification Value – Recognizing that geographically diverse portfolios may command valuation premiums due to reduced concentration risk
- Scenario Modeling – Developing multiple valuation scenarios based on different regional performance assumptions
Valuation Accuracy in Regional Markets: Addressing Specific Valuation Types

Different valuation purposes require different approaches to regional market divergence. A Red Book valuation for lending purposes demands different considerations than an insurance reinstatement valuation or capital gains tax assessment.
Mortgage Lending Valuations
Lenders face particular challenges in the current market environment. Regional divergence creates portfolio concentration risks that weren't apparent when national markets moved in relative harmony.
Key Considerations:
- Loan-to-Value Ratios – Northern markets with strong appreciation may support higher LTVs, while southern markets require more conservative lending
- Future Value Projections – Lenders increasingly request scenario analysis showing property values under different regional performance assumptions
- Market Liquidity Assessment – Properties in thin markets (even appreciating ones) present higher risk due to potential selling challenges
- Borrower Mobility – Mortgage lock-in effects vary by region, impacting refinancing likelihood and portfolio behavior
Insurance and Reinstatement Valuations
Insurance reinstatement valuations present unique challenges because rebuild costs don't necessarily correlate with market values—and regional construction cost variations don't mirror regional price performance.
Regional Rebuild Cost Factors:
- Labour Cost Variations – Construction labour costs may actually run higher in London despite flat property prices, while northern markets benefit from more competitive contractor rates
- Material Transportation – Remote northern properties may face higher material delivery costs offsetting other savings
- Building Code Requirements – Regional variations in planning requirements and building standards affect rebuild cost estimates
- Specialist Trade Availability – Period property restoration costs vary significantly based on local craftsperson availability
Tax-Related Valuations
ATED valuations, capital gains tax assessments, and inheritance tax valuations all require defensible market value opinions that may face HMRC scrutiny years after completion.
Documentation Requirements:
✍️ Comprehensive Market Analysis – Detailed documentation of regional market conditions at valuation date
✍️ Comparable Sales Justification – Clear explanation of why specific comparables were selected and how adjustments were derived
✍️ Regional Context – Explicit discussion of how local market performance differs from national trends
✍️ Methodology Transparency – Clear articulation of valuation approach, particularly where it deviates from standard practice due to regional factors
The Future of Valuation Accuracy: Emerging Trends and Challenges
As 2026 progresses, several emerging trends will further complicate regional valuation accuracy, requiring continued professional development and methodological innovation.
Climate Risk Integration
Climate-related risks increasingly affect property values differently across regions. Flood risk, coastal erosion, and extreme weather vulnerability create valuation adjustments that vary dramatically by location—and these risks don't correlate neatly with current price performance.
Northern markets experiencing strong appreciation may face long-term climate vulnerabilities that prudent valuations should reflect. Southern markets with flat current performance may include properties in climate-resilient locations that deserve valuation premiums.
Infrastructure Investment Divergence
Government infrastructure investment—particularly in transportation, digital connectivity, and energy systems—varies significantly across regions. The northern powerhouse initiative, HS2 developments, and regional development funding create future value drivers that forward-looking valuations should incorporate.
Surveyors must balance current market evidence with informed projections about how infrastructure investment will affect long-term property values, particularly for development site valuations and commercial property assessments.
Demographic Shifts and Remote Work
The sustained shift toward remote and hybrid work arrangements continues to reshape regional housing demand. Properties in northern markets offering space, affordability, and quality of life attract buyers who previously required London proximity for employment.
This demographic redistribution supports the current north-south divergence and suggests it may represent a structural shift rather than a cyclical phenomenon. Valuations must account for whether observed trends reflect temporary disruption or permanent market restructuring.
Regulatory and Professional Standards Evolution
The Royal Institution of Chartered Surveyors (RICS) continues updating professional standards to address regional market complexity. The Red Book valuation standards increasingly emphasize market-specific analysis, comparable sales justification, and uncertainty disclosure.
Professional surveyors must stay current with evolving standards while maintaining the judgment and local market knowledge that technology cannot replace. The future belongs to professionals who combine data analytics sophistication with deep regional market expertise.
Practical Implementation: A Surveyor's Regional Valuation Checklist
For working surveyors facing the daily challenge of accurate property valuation amid regional divergence, systematic process discipline provides essential quality assurance.
Pre-Inspection Regional Market Research
Before conducting property inspections, thorough regional market research establishes the context for valuation:
- Review latest regional price trend data (monthly, not quarterly)
- Analyze current inventory levels versus historical norms
- Identify recent comparable sales within appropriate geographic radius
- Research pending sales and withdrawn listings
- Evaluate local economic indicators (employment, wages, business investment)
- Review infrastructure projects and planning applications
- Assess insurance market conditions and climate risks
- Analyze buyer demographic and financial profile trends
On-Site Assessment Considerations
Physical property inspection remains irreplaceable, but regional context informs what surveyors look for:
- Evaluate property condition relative to local market standards
- Assess features that carry regional value premiums (gardens in urban northern markets, period features in heritage areas)
- Identify characteristics that affect regional marketability (parking in car-dependent areas, outdoor space in family markets)
- Document property attributes that facilitate comparable sales adjustment
- Photograph features requiring explanation in valuation report
Comparable Sales Analysis and Adjustment
The technical heart of valuation accuracy lies in rigorous comparable analysis:
- Select minimum three comparable sales (five preferred in complex markets)
- Document why each comparable was selected
- Apply time adjustments based on local market appreciation rates
- Adjust for property size, condition, and feature differences
- Weight comparables based on similarity and transaction recency
- Consider pending sales as market direction indicators
- Identify and exclude anomalous transactions with clear justification
- Calculate valuation range rather than single point estimate
Report Documentation and Disclosure
Professional valuation reports must clearly communicate regional market context:
- Explicitly discuss regional market conditions and how they differ from national trends
- Provide market data supporting valuation conclusions
- Disclose uncertainty ranges appropriate to market conditions
- Explain methodology choices, particularly where regional factors required adjustments
- Include appropriate caveats regarding market volatility and data limitations
- Ensure compliance with current RICS Red Book standards
- Retain comprehensive work files supporting valuation conclusions
Conclusion: Mastering Regional Valuation Accuracy in an Era of Divergence
The widening north-south price divergence that defines the 2026 UK property market represents both challenge and opportunity for professional surveyors. Markets that once moved in relative harmony now follow independent trajectories driven by local supply-demand dynamics, affordability thresholds, buyer demographics, and economic fundamentals.
Valuation Accuracy in Regional Markets: How Surveyors Navigate the Widening North-South Price Divergence in 2026 is not merely a technical challenge—it's a professional imperative that separates competent practitioners from exceptional ones. The surveyors who thrive in this environment combine traditional field skills with data analytics sophistication, local market expertise with national market perspective, and systematic methodology with case-specific judgment.
The evidence is clear: national averages mask critical regional differences that directly impact property values. Northern markets growing at 3-5% annually require different valuation approaches than London markets showing minimal appreciation. Inventory scarcity in high-performing markets creates valuation pressure absent in more balanced markets. Buyer financial profiles, mortgage lock-in effects, and insurance costs all vary regionally in ways that affect sustainable property values[1][2][4].
Actionable Next Steps for Property Professionals
For surveyors, lenders, investors, and property owners seeking to navigate this complex landscape:
-
Invest in Market Intelligence – Subscribe to regional market data services, attend local market briefings, and develop networks of professionals operating in target markets
-
Upgrade Technology Infrastructure – Implement or enhance GIS mapping, comparable sales databases, and predictive analytics tools that enable granular market analysis
-
Pursue Continuing Professional Development – Engage with RICS training on regional market analysis, advanced valuation methodologies, and emerging technology applications
-
Develop Regional Specialization – Build deep expertise in specific regional markets rather than attempting superficial coverage of all areas
-
Enhance Documentation Practices – Strengthen valuation report documentation to clearly communicate regional market context and methodology choices
-
Collaborate Across Regions – Develop professional networks enabling knowledge sharing about regional market conditions and best practices
-
Engage Professional Expertise – For complex valuations or unfamiliar markets, consult with experienced chartered surveyors who maintain current regional market knowledge
The regional property market divergence of 2026 is not a temporary aberration requiring short-term adaptation. It represents a fundamental restructuring of UK property values driven by structural forces including affordability migration, remote work adoption, infrastructure investment patterns, and climate risk differentiation. These forces will shape property markets for years to come.
Surveyors who recognize this reality and systematically adapt their valuation methodologies will deliver superior accuracy, better serve their clients, and maintain professional credibility in an increasingly complex market environment. Those who continue applying yesterday's methodologies to today's fragmented markets risk valuation errors with serious financial and professional consequences.
The path forward requires intellectual humility (acknowledging the limitations of historical data and national trends), technological sophistication (leveraging advanced analytics while maintaining professional judgment), and unwavering commitment to accuracy (even when market complexity makes definitive conclusions elusive).
In an era of regional divergence, valuation accuracy isn't just about getting the number right—it's about understanding the market forces driving that number, communicating the uncertainty inherent in current market conditions, and providing clients with the insights they need to make informed property decisions. That is the standard to which the profession must hold itself in 2026 and beyond.
References
[1] Realtorcom Reveals The Top Housing Markets For 2026 – https://www.morningstar.com/news/pr-newswire/20251210la42899/realtorcom-reveals-the-top-housing-markets-for-2026
[2] Navigating 2026 With Advanced Mark To Market Analytics – https://www.veros.com/navigating-2026-with-advanced-mark-to-market-analytics
[4] 10 Things To Know About The Property Market January 2026 – https://www.cotality.com/press-releases/10-things-to-know-about-the-property-market-january-2026