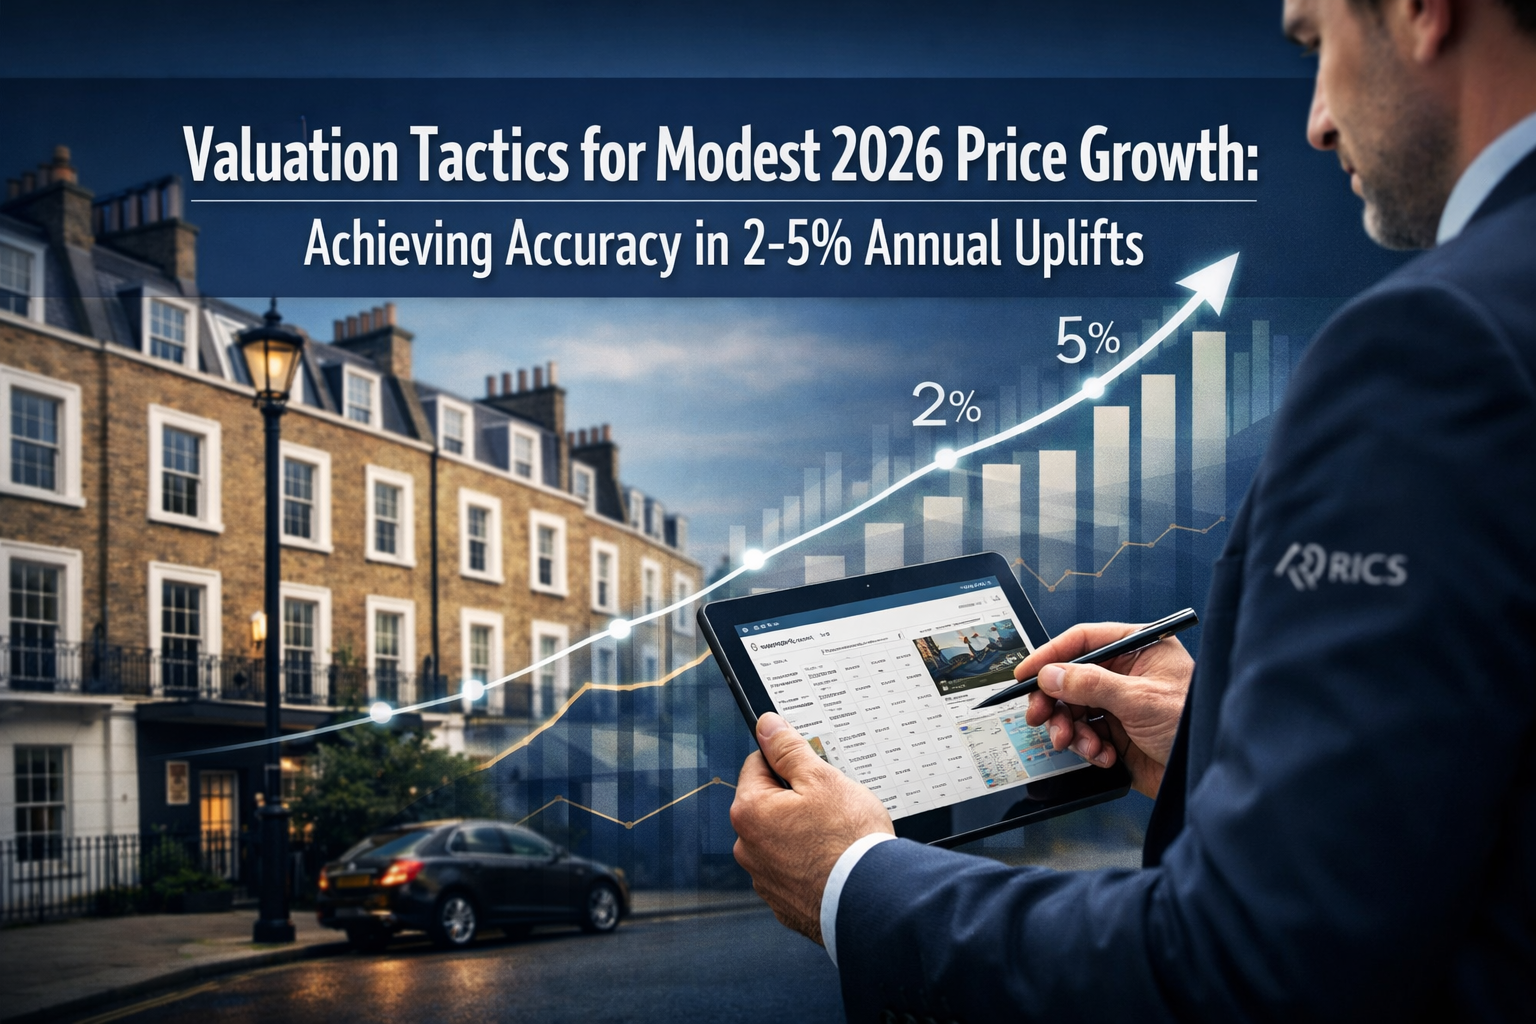
Property valuations during periods of minimal price appreciation demand a fundamentally different skill set than those conducted during boom cycles. With UK property markets expected to deliver subdued growth between 2% and 5% annually through 2026, chartered surveyors face the technical challenge of distinguishing genuine value shifts from market noise—a task requiring precision that exceeds standard methodologies. Valuation Tactics for Modest 2026 Price Growth: Achieving Accuracy in 2-5% Annual Uplifts represent the professional response to this low-volatility environment, where traditional margin-of-error tolerances become unacceptable and where RICS-compliant techniques must adapt to capture nuanced market movements.
The stakes have never been higher for accuracy. When annual price movements hover near inflation rates, a 1% valuation error can represent the entire year's capital appreciation—or depreciation. This article explores the specialist tactics, refined comparable analysis methods, and risk adjustment frameworks that enable surveyors to deliver defensible valuations in markets characterized by stability rather than volatility.
Key Takeaways
- Narrow vertical benchmarking has replaced broad market comparisons, requiring surveyors to identify highly specific comparable properties within tight geographic and typological parameters
- Forward-facing metrics now dominate valuation discussions, with buyers and lenders prioritizing growth projections, rental yield forecasts, and risk modeling over historical performance data
- AI-driven valuation tools are transforming accuracy standards by identifying inconsistencies and pressure-testing assumptions across thousands of comparable transactions simultaneously
- Regional variation analysis becomes critical in modest growth environments, where 2-5% national averages mask significant local divergence requiring granular market knowledge
- Alternative deal structures incorporating earnouts and deferred payments demand valuations that clarify timing, probability, and conditional triggers—not just headline figures
Understanding the 2026 Modest Growth Environment
The property market landscape of 2026 presents a unique set of circumstances that demand recalibrated valuation approaches. Home price growth is forecast to remain minimal at approximately 2-3% annually, closely aligning with consumer price inflation levels[6]. This represents a dramatic shift from the volatile swings experienced in previous years, creating what economists describe as a "normalized" market environment.
As of January 2026, house prices are expected to stall at approximately 0% growth for the year, though home sales are projected to gradually improve as inventory levels increase[5]. This stabilization follows a period of adjustment where the lock-in effect—homeowners reluctant to sell due to favorable existing mortgage rates—begins to dissipate as life-changing events prompt more property listings[6].
The Commercial Real Estate Context
Interestingly, while residential markets show modest growth, commercial real estate investment activity is expected to surge by 16% in 2026 to $562 billion, nearly matching pre-pandemic annual averages[4]. This divergence highlights the importance of sector-specific valuation tactics, as different property types respond to distinct economic drivers.
The broader economic backdrop includes annual U.S. GDP growth forecasted to slow to 2.0% in 2026, with softening labor market conditions and marginally lower inflation averaging 2.5%[4]. UK markets mirror these trends, creating an environment where property values track closely with fundamental economic indicators rather than speculative momentum.
Why Modest Growth Demands Precision
In high-volatility markets, valuation margins of error are often absorbed by rapid price movements. A 5% valuation discrepancy becomes irrelevant when prices rise 15% annually. However, when annual appreciation hovers between 2-5%, that same 5% error represents one to two years of capital growth—a material difference for buyers, sellers, lenders, and investors.
For RICS registered valuers in London and across the UK, this environment necessitates enhanced rigor in comparable selection, adjustment methodology, and risk assessment. The professional reputation increasingly depends on demonstrable accuracy within tight tolerances.
Core Valuation Tactics for Modest 2026 Price Growth: Achieving Accuracy in 2-5% Annual Uplifts

Narrow Vertical Benchmarking
The valuation landscape has fundamentally shifted from broad industry averages to narrow vertical benchmarking. Buyers and lenders now compare properties within extremely tight parameters, awarding premiums only to those demonstrating strategic fit, superior condition, and forward visibility[1].
For surveyors, this means:
🎯 Comparable Selection Criteria Must Tighten
- Geographic radius: Reduce from 1-mile to 0.5-mile or specific postcode sectors
- Property type matching: Exact construction period, architectural style, and building materials
- Condition parity: Only use comparables with similar maintenance standards and recent improvement histories
- Timing precision: Prioritize transactions within the last 3-6 months over 12-month windows
📊 Adjustment Factors Require Granularity
When annual growth sits at 2-5%, adjustment factors for differences between subject properties and comparables must achieve precision:
| Adjustment Category | Traditional Range | Modest Growth Range |
|---|---|---|
| Time adjustment (per month) | ±0.5-1.0% | ±0.15-0.40% |
| Condition variance | ±5-10% | ±2-5% |
| Location micro-variation | ±3-8% | ±1-3% |
| Size adjustment (per sq ft) | ±£10-30 | ±£5-15 |
These tighter ranges reflect market realities where buyers scrutinize every valuation component. Understanding valuation factors becomes essential for defensible adjustments.
Forward-Facing Metrics Integration
Buyers have moved beyond backward-looking performance metrics. Valuation discussions in 2026 now start with growth projections, rental yield forecasts, and sales pipeline strength[1]. Revenue history remains relevant, but forward-facing data drives pricing decisions.
For residential valuations:
- Rental yield trajectory analysis (current vs. projected 12-24 months)
- Local employment growth forecasts
- Infrastructure development timelines (transport links, schools, amenities)
- Planning permission pipeline for area density changes
For commercial properties:
- Tenant covenant strength and lease renewal probability
- Sector-specific demand forecasts (e.g., logistics, life sciences, tech)
- Environmental performance certificates and retrofit potential
- Obsolescence risk assessment
This forward-looking approach requires surveyors to incorporate data-driven projections and risk modeling into traditional comparable analysis. The best London property valuation guide emphasizes this integrated methodology.
Enhanced Comparable Analysis Techniques
Traditional comparable analysis relied on identifying three to five similar properties and making broad adjustments. Modest growth environments demand more sophisticated approaches:
✅ Statistical Clustering Methods
Rather than selecting individual comparables, analyze clusters of 10-20 similar transactions to identify:
- Median price per square foot with standard deviation
- Price distribution patterns revealing market segmentation
- Outlier transactions requiring investigation
- Temporal trends across the transaction set
✅ Paired Sales Analysis
Identify properties that sold twice within the analysis period to isolate pure time-based appreciation:
- Calculate actual appreciation rates for specific property types
- Eliminate condition and improvement variables
- Establish baseline growth rates for micro-markets
- Validate or challenge broader market assumptions
✅ Regression-Based Adjustments
For markets with sufficient transaction volume, employ regression analysis to quantify adjustment factors:
- Price per square foot as dependent variable
- Independent variables: age, condition, location sub-zones, features
- Generate statistically-derived adjustment coefficients
- Reduce subjective judgment in comparable adjustments
These techniques align with professional standards for valuation in London and other major UK markets.
AI-Driven Valuation Tools and Technology Integration

The transformation of valuation practice through artificial intelligence represents one of the most significant developments affecting Valuation Tactics for Modest 2026 Price Growth: Achieving Accuracy in 2-5% Annual Uplifts. AI-driven platforms are reshaping how surveyors identify comparables, benchmark values, and pressure-test assumptions[1].
Automated Comparable Identification
Modern AI platforms scan entire markets simultaneously, identifying potential comparables based on:
- Multi-dimensional similarity scoring across 50+ property attributes
- Natural language processing of property descriptions to match features
- Image recognition analyzing property photographs for condition and style
- Geospatial analysis accounting for micro-location factors invisible to traditional search
These systems reduce comparable identification time from hours to minutes while expanding the search universe beyond human capacity.
Operational and Cash Flow Inconsistency Detection
AI excels at identifying anomalies that human reviewers might miss:
- Rental income figures inconsistent with market norms
- Operating expense ratios outside typical ranges
- Capital expenditure patterns suggesting deferred maintenance
- Occupancy claims contradicting utility usage data
By flagging operational or cash flow inconsistencies early[1], these tools enable surveyors to request additional documentation before finalizing valuations, reducing revision risk.
Scenario Modeling and Assumption Testing
Generative AI capabilities now allow surveyors to:
🔍 Simulate Multiple Market Scenarios
- Best case: Sustained 5% annual growth with improving market conditions
- Base case: 2-3% growth tracking inflation
- Downside case: Flat or negative growth with economic headwinds
🔍 Pressure-Test Valuation Assumptions
- Sensitivity analysis on key adjustment factors
- Monte Carlo simulations for uncertainty quantification
- Comparative scenario outcomes across different methodologies
🔍 Expose Blind Spots Before Negotiations
AI identifies logical inconsistencies in valuation reasoning:
- Adjustment factors that contradict stated market conditions
- Comparable selections that introduce systematic bias
- Growth assumptions inconsistent with economic forecasts
This technological integration doesn't replace professional judgment—it enhances it by providing comprehensive data analysis that would be impractical manually.
Implementation Considerations
Surveyors adopting AI-driven tools should:
- ✅ Maintain professional skepticism regarding AI outputs
- ✅ Validate AI-identified comparables through traditional due diligence
- ✅ Document AI tool usage in valuation reports for transparency
- ✅ Ensure AI platforms comply with RICS data standards
- ✅ Continuously calibrate AI models against actual market outcomes
The integration of technology with traditional surveying expertise creates a powerful combination for achieving the precision required in modest growth markets.
Regional Variation Analysis and Local Market Intelligence
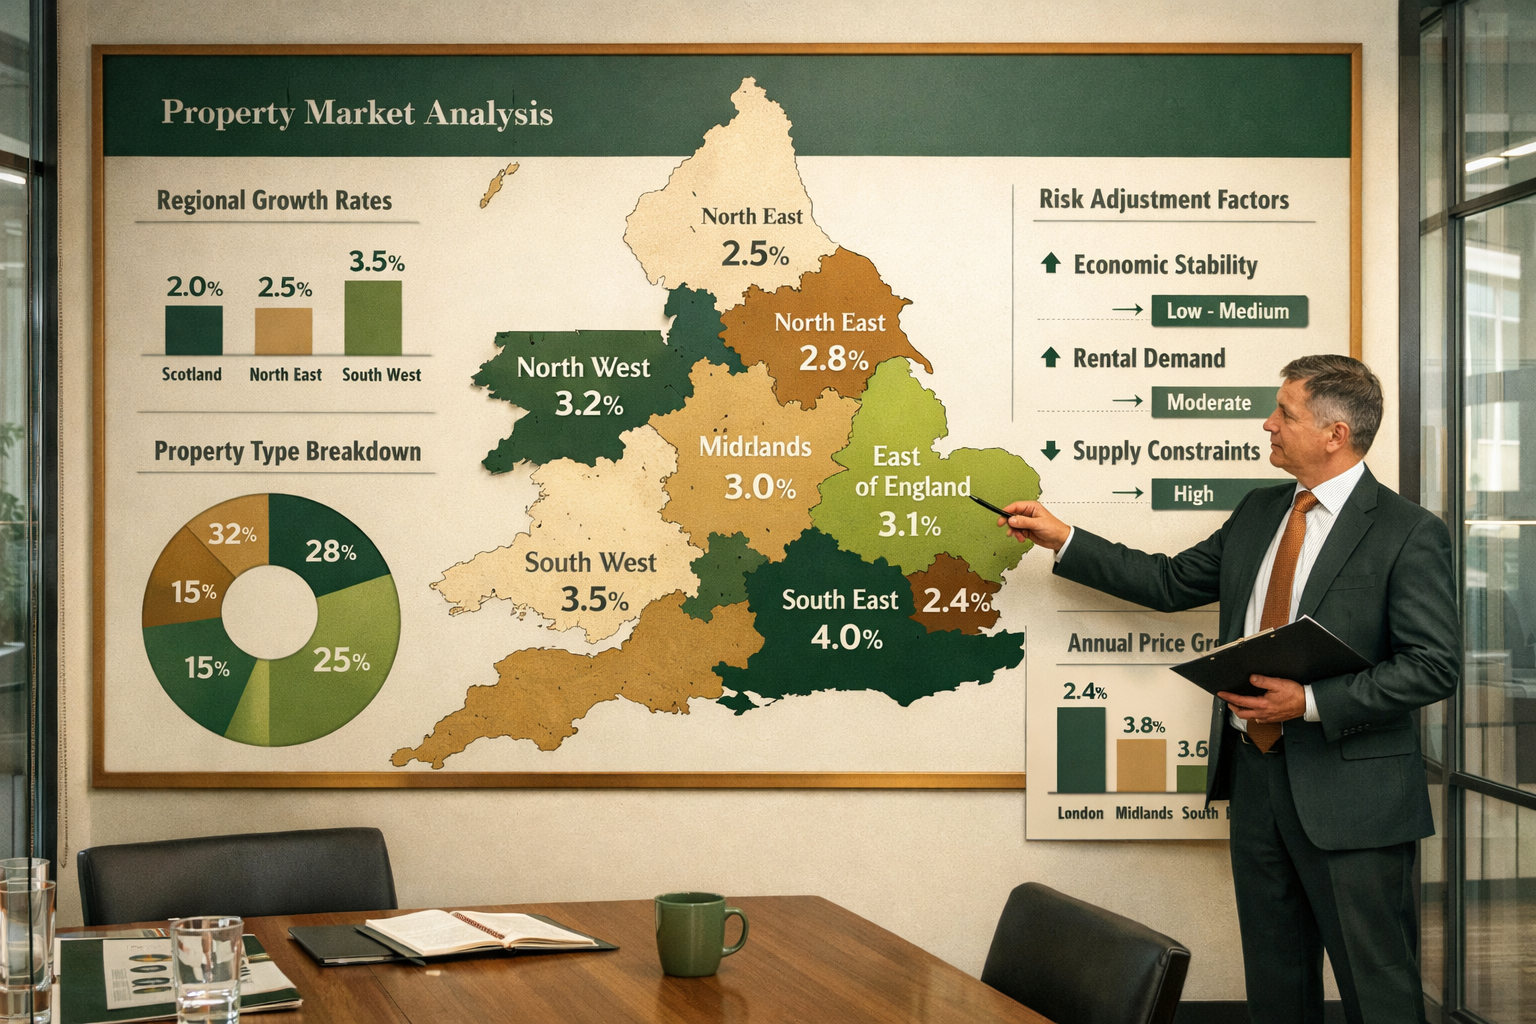
One of the most critical aspects of Valuation Tactics for Modest 2026 Price Growth: Achieving Accuracy in 2-5% Annual Uplifts involves recognizing that national averages mask significant regional divergence. A 2-5% national forecast conceals markets experiencing 8-10% growth alongside others facing flat or declining values.
The Regional Divergence Reality
Home sales are expected to increase by approximately 14% nationwide in 2026[6], but this recovery manifests unevenly:
High-Growth Regional Characteristics:
- Strong employment hubs with diverse economic bases
- Infrastructure investment corridors (HS2, Crossrail extensions)
- University cities with sustained rental demand
- Areas with constrained supply and planning restrictions
Flat or Declining Regional Characteristics:
- Post-industrial areas with limited economic diversification
- Regions with high new-build supply relative to demand
- Areas experiencing net population outmigration
- Markets heavily dependent on single-sector employment
For surveyors, this means national growth forecasts provide limited guidance for specific property valuations. Granular local market intelligence becomes essential.
Building Local Market Intelligence Systems
Professional valuers in modest growth environments must develop systematic approaches to local market monitoring:
📈 Transaction Database Maintenance
- Compile all local transactions with detailed attribute data
- Track time-on-market trends as leading indicators
- Monitor asking-to-achieved price ratios
- Document withdrawn listings and re-listings
📈 Development Pipeline Tracking
- Planning applications and approvals
- Construction commencement and completion timelines
- Affordable housing allocations affecting market mix
- Commercial-to-residential conversions
📈 Economic Indicator Monitoring
- Local employment statistics and major employer announcements
- Retail vacancy rates as economic health proxies
- School performance trends affecting family buyer demand
- Transport connectivity improvements and timelines
📈 Stakeholder Network Cultivation
- Regular dialogue with local estate agents
- Relationships with planning officers and council officials
- Connections with local developers and builders
- Engagement with property management companies
This intelligence-gathering infrastructure enables surveyors to identify when local conditions diverge from regional or national trends—critical for accurate valuations.
Micro-Market Segmentation
Within single postcodes, significant value variations exist. Effective valuation requires identifying micro-market boundaries:
- Street-level variations: Main roads vs. quiet residential streets
- Proximity gradients: Distance to stations, parks, schools
- Environmental factors: Noise, air quality, flood risk zones
- Social infrastructure: Community facilities, crime statistics
These micro-market distinctions become magnified in modest growth environments where buyers exercise heightened selectivity. Understanding these nuances separates competent from exceptional valuation work.
Risk Adjustment Frameworks for Low-Volatility Markets
Modest growth markets require explicit risk adjustment frameworks that account for the reduced margin for error. Traditional valuation approaches often embed risk considerations implicitly; low-volatility environments demand explicit quantification.
Systematic Risk Assessment
Professional valuations should incorporate formal risk scoring across multiple dimensions:
🎯 Market Liquidity Risk
- Days on market trends for comparable properties
- Transaction volume trends (increasing or decreasing)
- Buyer demographic diversity (single buyer type vs. multiple)
- Seasonal variation patterns
🎯 Property-Specific Risk
- Condition and deferred maintenance exposure
- Lease structure and tenant covenant (commercial)
- Planning constraints and development potential
- Environmental and structural concerns
🎯 Economic Sensitivity Risk
- Local employment concentration and sector exposure
- Interest rate sensitivity of typical buyer demographic
- Discretionary income levels in target market
- Economic forecast uncertainty for region
Each risk dimension receives a scoring (low/medium/high), with aggregate scores informing valuation range width and central estimate positioning.
Valuation Range Reporting
In modest growth markets, single-point valuations provide false precision. Professional practice increasingly adopts valuation range reporting:
- Narrow range (±2-3%): Low-risk properties in liquid markets with strong comparables
- Moderate range (±4-5%): Average risk profile with adequate comparable evidence
- Wide range (±6-8%): Higher risk properties, thin comparable evidence, or uncertain market conditions
This approach acknowledges inherent uncertainty while providing clients with realistic expectations. For specialized valuations like probate valuation in London, range reporting offers additional defensibility.
Alternative Deal Structure Implications
As market volatility and capital costs remain elevated, deal structures incorporating earnouts, seller financing, and deferred payments are becoming standard[1]. These structures create valuation complexity:
Earnout Valuations Require:
- Probability-weighted scenario analysis
- Performance metric definitions and measurement protocols
- Discount rate selection for deferred payment streams
- Contingency and trigger condition clarification
Seller Financing Considerations:
- Credit risk assessment of buyer
- Security position and recourse provisions
- Interest rate and term structure impact on effective price
- Default scenario implications
Surveyors must clarify timing, probability, and conditions tied to each payment component[1], not merely headline transaction values. This granularity proves essential for divorce valuation on property in London and other contexts requiring precise value allocation.
Sector-Specific Valuation Considerations
Different property sectors respond to distinct value drivers in modest growth environments. Effective Valuation Tactics for Modest 2026 Price Growth: Achieving Accuracy in 2-5% Annual Uplifts must account for these variations.
Residential Property Valuation
The residential market presents unique challenges in 2026, including an inverted pricing dynamic where median resale home prices exceed median new-build prices—a phenomenon occurring only two or three times in recent decades[6]. This inversion stems from:
- Builder incentives including price cuts and rate buy-downs
- Geographic distribution of new construction (often peripheral locations)
- Specification differences between new-build and period properties
Key residential valuation tactics:
- ✅ Separate analysis of new-build vs. resale comparable sets
- ✅ Quantification of builder incentive impact on effective pricing
- ✅ Location premium/discount modeling for new developments
- ✅ Specification and warranty value assessment
Commercial Real Estate Valuation
Commercial property investment activity is surging despite modest overall growth, with technology-driven services, healthcare platforms, supply chain automation, and AI infrastructure receiving the strongest valuation multiples[1].
Premium sectors demonstrate:
- Recurring revenue models with high visibility
- Operational efficiency and scalability
- Exposure to long-term growth themes (data, digitalization)
- ESG compliance and environmental performance
Valuers must assess how individual properties align with or diverge from these premium characteristics. A commercial building survey in London should explicitly evaluate these strategic positioning factors.
Specialized Valuation Contexts
Certain valuation purposes require adapted approaches in modest growth markets:
Charity Act Valuations
Charities Act valuation under RICS standards demands particular conservatism in growth assumptions, ensuring charitable assets aren't overvalued during disposal decisions.
Shared Ownership Valuations
Shared ownership valuation requires careful consideration of staircasing implications and market value impacts of ownership structure—factors magnified when growth rates are modest.
Reinstatement Cost Assessments
Reinstatement cost valuation for insurance purposes must account for construction cost inflation potentially exceeding property value inflation—a critical distinction in low-growth markets.
Professional Standards and Documentation Requirements
Achieving accuracy in modest growth valuations requires rigorous adherence to professional standards and comprehensive documentation practices.
RICS Red Book Compliance
The RICS Valuation – Global Standards (Red Book) provides the framework for professional valuation practice. In low-volatility markets, particular attention should focus on:
📋 Basis of Value Clarity
- Explicit statement of whether Market Value, Market Rent, or alternative basis applies
- Clear definition of special assumptions or departures from standard definitions
- Documentation of any constraints affecting valuation approach
📋 Comparable Evidence Documentation
- Detailed comparable property schedules with adjustment rationale
- Evidence of comparable verification (not merely listing data)
- Explanation of comparable selection criteria and rejection reasons
- Time adjustment methodology and market evidence supporting rates
📋 Assumptions and Special Assumptions
- Explicit statement of all material assumptions
- Justification for special assumptions with client agreement
- Sensitivity analysis showing valuation impact of key assumptions
- Limitations and caveats clearly communicated
📋 Valuation Uncertainty
- Material uncertainty declarations when appropriate
- Confidence level statements or valuation ranges
- Market condition commentary affecting reliability
Report Structure Best Practices
Professional valuation reports in modest growth environments should include:
- Executive Summary with valuation conclusion and key qualifications
- Market Context Analysis with growth forecasts and economic backdrop
- Property Description with comprehensive attribute documentation
- Comparable Analysis with detailed adjustment schedules
- Valuation Approach explaining methodology selection and application
- Risk Assessment with explicit risk factor evaluation
- Conclusions and Limitations with appropriate caveats
This structured approach ensures clients understand not just the valuation figure but the reasoning, evidence, and uncertainty surrounding it.
Quality Assurance and Peer Review Processes
When margins for error narrow, quality assurance becomes paramount. Leading surveying practices implement systematic review processes:
Internal Review Protocols
🔍 Peer Review Requirements
- All valuations reviewed by second qualified surveyor
- Focus on comparable selection appropriateness and adjustment reasonableness
- Verification of calculation accuracy and logical consistency
- Challenge of assumptions and methodology choices
🔍 Technical Review Checklists
- Standardized checklists ensuring comprehensive coverage
- Verification of Red Book compliance elements
- Confirmation of data source reliability and currency
- Documentation completeness assessment
🔍 Calibration Studies
- Periodic comparison of valuations against subsequent transaction prices
- Analysis of systematic biases or error patterns
- Methodology refinement based on outcome data
- Individual surveyor performance feedback
External Validation
For high-value or contentious valuations, external validation provides additional assurance:
- Independent third-party review by specialist valuers
- Academic or research institution methodology assessment
- Industry body consultation on novel or complex approaches
- Client-appointed reviewing surveyor engagement
These quality assurance measures protect both professional reputation and client interests in environments where small errors carry significant consequences.
Practical Implementation: A Case Study Approach
Consider a practical example illustrating Valuation Tactics for Modest 2026 Price Growth: Achieving Accuracy in 2-5% Annual Uplifts:
Property: Victorian terraced house, 3 bedrooms, 1,200 sq ft, South West London
Valuation Date: March 2026
Market Context: Local market showing 2.8% annual growth based on Land Registry data
Traditional Approach Limitations
A conventional valuation might:
- Identify 3-4 comparables within 1-mile radius sold in last 12 months
- Apply broad time adjustments of 0.5% per month
- Make subjective condition adjustments of ±5%
- Arrive at single-point valuation of £725,000
Weaknesses: Wide comparable selection geography, coarse time adjustments, limited evidence base, false precision.
Enhanced Approach Application
An enhanced methodology employing modest growth tactics:
Step 1: Narrow Comparable Selection
- Identify 12 comparables within 0.5-mile radius (same postcode sector)
- Restrict to Victorian terraced properties 1,100-1,300 sq ft
- Limit to transactions within last 6 months
- Verify all comparables through multiple data sources
Step 2: Statistical Analysis
- Calculate median price per sq ft: £604
- Standard deviation: £28 per sq ft
- Identify and investigate outliers (±2 standard deviations)
- Establish baseline value range: £725,000-£735,000 (1,200 sq ft × £604 ± £28)
Step 3: Granular Adjustments
- Time adjustments: 0.23% per month (derived from paired sales analysis)
- Condition adjustment: +2% (subject property superior to median)
- Micro-location adjustment: -1% (main road vs. quiet streets in comparable set)
- Net adjustment: +1% to median
Step 4: Forward-Looking Validation
- Local employment growth forecast: +1.5% annually
- Transport infrastructure: Crossrail extension completion 2027 (+demand factor)
- New supply pipeline: Limited (planning constraints support values)
- Assessment: Base case 2.8% growth sustainable
Step 5: Risk-Adjusted Range
- Low risk property in liquid market
- Strong comparable evidence base
- Narrow valuation range appropriate: ±2.5%
- Final valuation range: £715,000-£740,000
- Central estimate: £728,000
This enhanced approach provides defensible accuracy appropriate for modest growth conditions, with explicit documentation of methodology and assumptions.
Future Trends and Evolving Valuation Practices
Looking beyond 2026, several trends will continue shaping valuation practices in modest growth environments:
Increased Data Integration
Valuation accuracy will increasingly depend on comprehensive data integration:
- Alternative data sources: Satellite imagery, mobile location data, social media sentiment
- Real-time market monitoring: Continuous price index updates rather than lagged official statistics
- Environmental data integration: Climate risk, air quality, noise pollution quantification
- Economic leading indicators: Employment postings, consumer spending patterns, business formation rates
Automation and Efficiency
While maintaining professional judgment, routine valuation elements will automate:
- Comparable identification and preliminary screening
- Standard adjustment calculations and documentation
- Report generation for straightforward properties
- Quality assurance checks and compliance verification
This automation frees surveyors to focus on judgment-intensive aspects: comparable selection refinement, adjustment factor determination, risk assessment, and client communication.
Regulatory Evolution
Professional standards will continue evolving to address emerging challenges:
- Enhanced climate risk disclosure requirements
- Standardized uncertainty and confidence level reporting
- Increased transparency regarding AI tool usage
- Stricter independence and conflict-of-interest protocols
Surveyors must stay current with regulatory developments while maintaining core professional competencies.
Conclusion
Valuation Tactics for Modest 2026 Price Growth: Achieving Accuracy in 2-5% Annual Uplifts represent a fundamental recalibration of professional practice for low-volatility market environments. When annual price movements hover near inflation rates, the margin for valuation error shrinks dramatically, demanding enhanced precision in comparable analysis, adjustment methodology, and risk assessment.
The key principles underpinning accurate valuations in modest growth markets include:
✅ Narrow vertical benchmarking with tightly defined comparable selection criteria
✅ Forward-facing metrics prioritizing growth projections and risk modeling
✅ AI-driven tools enhancing data analysis and assumption testing
✅ Regional variation analysis recognizing that national averages mask local divergence
✅ Explicit risk frameworks with valuation range reporting acknowledging uncertainty
✅ Sector-specific approaches accounting for distinct value drivers across property types
✅ Rigorous quality assurance with peer review and calibration studies
For chartered surveyors, estate agents, lenders, and property investors, these tactics provide the methodological foundation for defensible valuations in markets characterized by stability rather than volatility. The professional surveyors who master these techniques will distinguish themselves through demonstrable accuracy and client confidence.
Actionable Next Steps
For property professionals seeking to implement these valuation tactics:
- Audit current comparable selection practices against narrow benchmarking standards
- Develop local market intelligence systems for granular regional analysis
- Evaluate AI-driven valuation tools for integration with traditional methods
- Implement formal risk assessment frameworks with explicit scoring criteria
- Adopt valuation range reporting for appropriate property types and contexts
- Establish peer review protocols ensuring quality assurance
- Pursue continuing professional development in advanced valuation techniques
The modest growth environment of 2026 and beyond demands nothing less than excellence in valuation practice. Those who rise to this challenge will not only serve clients effectively but advance the profession's standards and reputation.
For specialized valuation services employing these advanced tactics, professional valuation services provide the expertise and rigor required for accuracy in low-volatility markets.
References
[1] Valuation Trends 2026 – https://www.sunbeltatlanta.com/blog/valuation-trends-2026
[2] Valuation Accuracy Under Modest Price Growth Surveyor Tactics For 2 5 Annual Uplift Forecasts In 2026 – https://nottinghillsurveyors.com/blog/valuation-accuracy-under-modest-price-growth-surveyor-tactics-for-2-5-annual-uplift-forecasts-in-2026
[3] 2026 Market Return Forecast Range – https://lanceroberts.substack.com/p/2026-market-return-forecast-range
[4] Us Real Estate Market Outlook 2026 – https://www.cbre.com/insights/books/us-real-estate-market-outlook-2026
[5] Us Housing Market Outlook – https://www.jpmorgan.com/insights/global-research/real-estate/us-housing-market-outlook
[6] 2026 Real Estate Outlook What Leading Housing Economists Are Watching – https://www.nar.realtor/magazine/real-estate-news/2026-real-estate-outlook-what-leading-housing-economists-are-watching