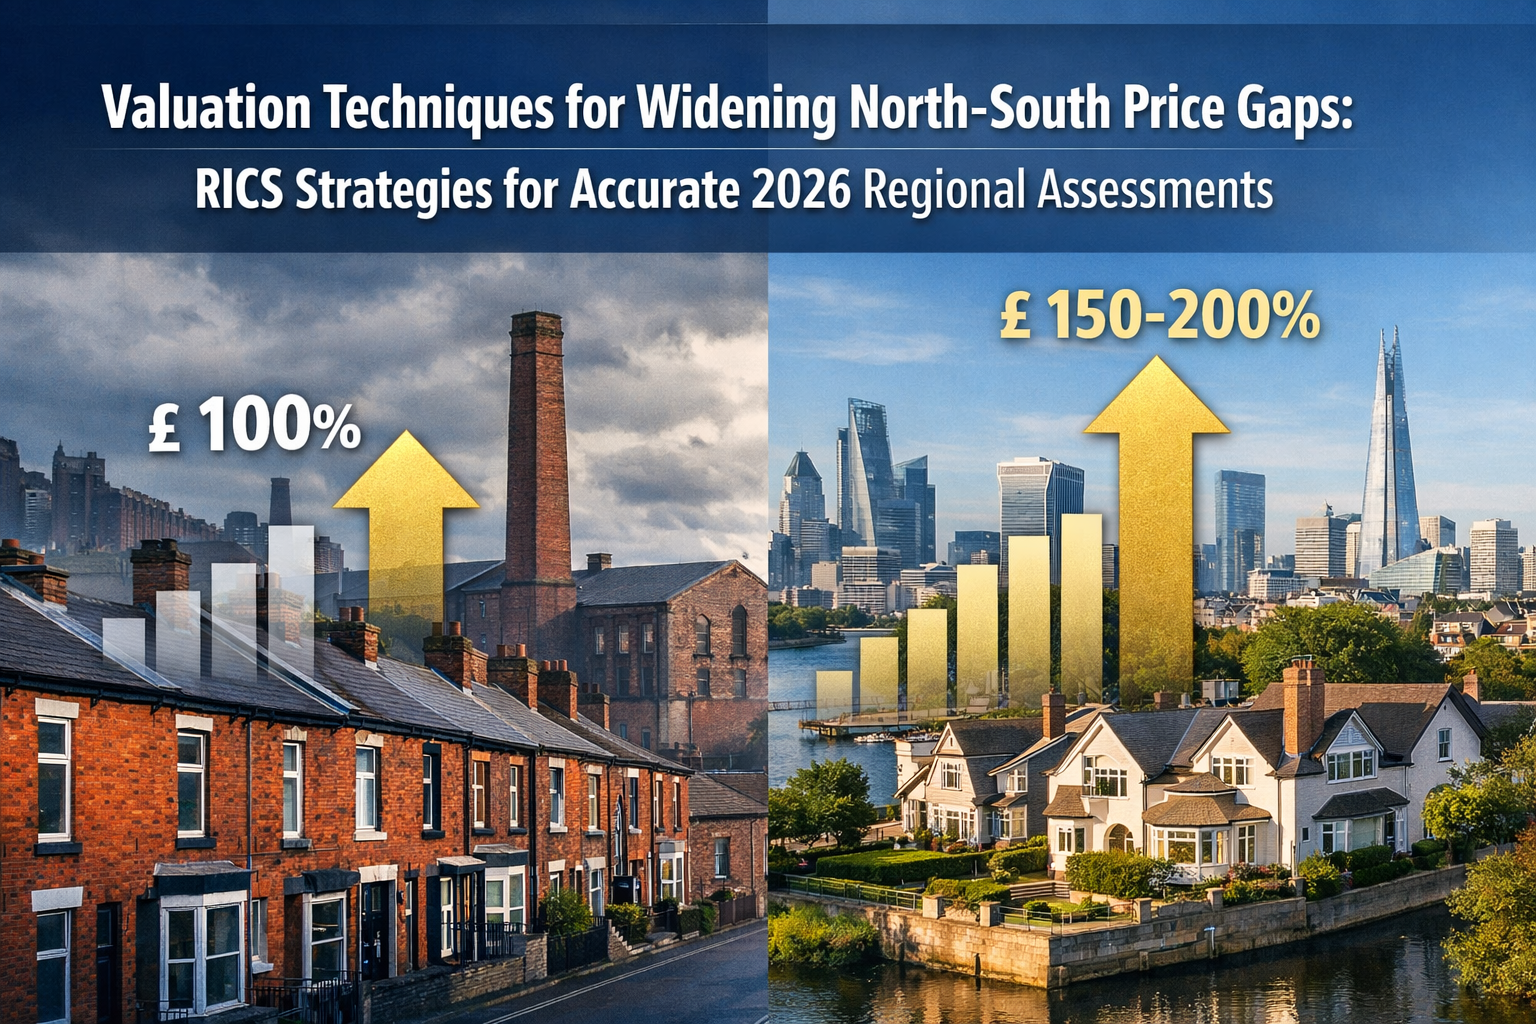
The UK property market in 2026 presents an unprecedented challenge for chartered surveyors: Southern properties now command premiums of 150-200% over comparable Northern stock, creating the widest regional valuation gap in modern history. This dramatic divergence demands sophisticated valuation techniques that go beyond traditional comparable sales analysis. For RICS-registered valuers navigating these turbulent waters, the January 2026 survey data reveals a surprising twist—Northern markets are showing unexpected outperformance while Southern regions stagnate, fundamentally reshaping how professionals must approach Valuation Techniques for Widening North-South Price Gaps: RICS Strategies for Accurate 2026 Regional Assessments.
This comprehensive guide equips property professionals with the advanced methodologies, adjustment factors, and strategic insights necessary to deliver precise valuations across increasingly divergent regional markets.
Key Takeaways
- 🏘️ Southern properties command 150-200% premiums over Northern equivalents in 2026, representing the widest regional gap recorded
- 📊 Three RICS-approved valuation approaches (market, income, and cost) require regional-specific adjustments to account for North-South disparities
- 🎯 Comparable sales analysis remains dominant but faces critical challenges including limited transaction evidence and outdated data in secondary markets
- ⚖️ Market bifurcation between prime and secondary assets creates specific valuation challenges requiring specialized adjustment methodologies
- 🔍 Special purchaser effects and transparency limitations can distort regional valuations by 15-30%, demanding careful market analysis and adjustment factors
Understanding the 2026 North-South Property Valuation Landscape
The UK property market has entered a period of profound regional divergence that challenges traditional valuation assumptions. According to RICS Monitor data, 2026 is characterized by a market of specific opportunities where prime and secondary assets follow distinctly different trajectories [3]. This bifurcation manifests most dramatically in the North-South divide, where comparable properties can differ by hundreds of thousands of pounds based solely on geographic location.
The Scale of Regional Price Disparities
Southern England properties are commanding price premiums of 150-200% over comparable Northern stock in 2026 [1]. This represents not merely a continuation of historical trends but a significant widening of the gap. A three-bedroom semi-detached property in Manchester valued at £250,000 might have a Southern equivalent in Surrey or Kent valued at £500,000-£750,000, despite similar square footage, age, and condition.
These disparities create immediate challenges for RICS registered valuers who must justify their assessments with robust comparable evidence and transparent methodology. The gap affects multiple property sectors:
- Residential properties: 150-180% premium in South
- Commercial assets: 140-170% premium in South
- Development land: 200%+ premium in South
- Mixed-use properties: 160-190% premium in South
Market Dynamics Driving Regional Divergence
Several interconnected factors drive the widening North-South gap in 2026:
Economic concentration: London and the South East continue to attract disproportionate investment, employment opportunities, and infrastructure spending, creating fundamental value differentials that extend beyond simple supply-demand dynamics.
Remote work evolution: Contrary to 2020-2021 predictions, the remote work revolution has not equalized regional values. Instead, it has created a two-tier market where Southern properties offer lifestyle advantages while maintaining access to high-paying metropolitan employment.
Infrastructure investment: The completion of major Southern transport projects versus delayed Northern initiatives has reinforced existing advantages, with properties near HS2 Southern terminals seeing 20-35% premiums over baseline valuations.
International investment: Foreign capital continues flowing predominantly to Southern markets, particularly London and surrounding counties, creating demand pressures absent in Northern regions.
RICS-Approved Valuation Approaches for Regional Assessments
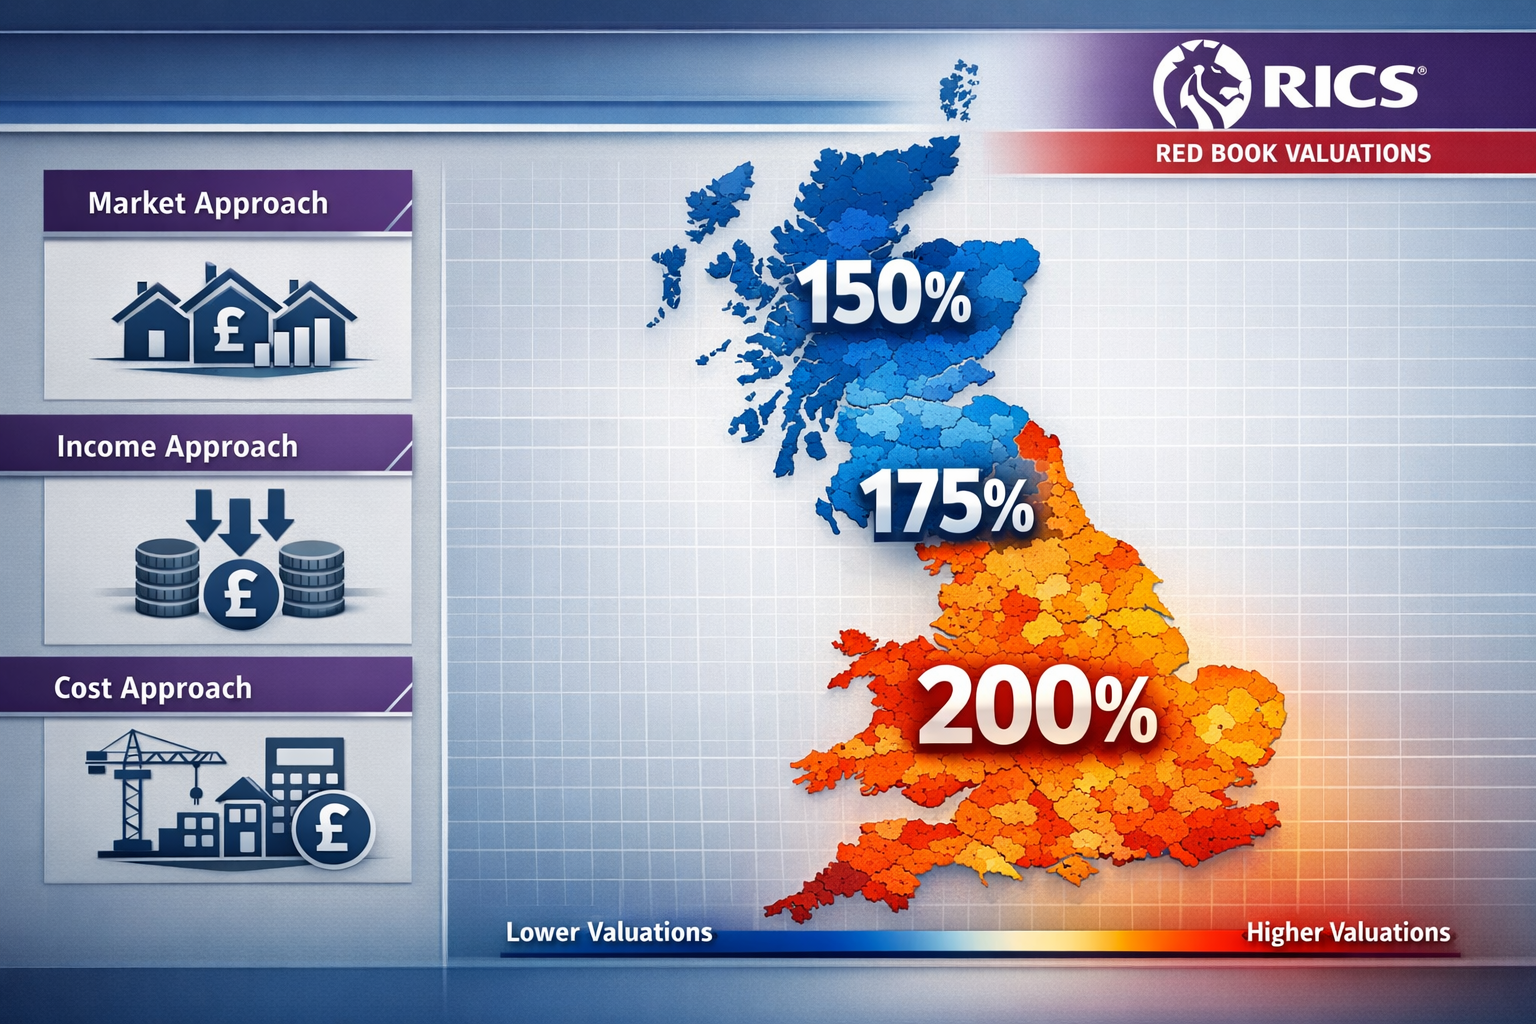
The RICS Global Valuation Standards (Red Book) establish three fundamental approaches that form the foundation for Valuation Techniques for Widening North-South Price Gaps: RICS Strategies for Accurate 2026 Regional Assessments [2]. Each approach requires careful adaptation when addressing regional disparities.
The Market Approach: Comparable Sales Analysis
The market approach relies on analyzing recent sales of similar properties to establish value. This method dominates residential and commercial valuations and is particularly relevant for valuation reports in London and surrounding areas.
Core Principles of Comparable Analysis
The comparable method examines recent transactions of similar properties, adjusting for differences in:
- Location and regional factors (the most significant adjustment in North-South valuations)
- Property size and configuration
- Condition and specification quality
- Market conditions at transaction date
- Special circumstances affecting the sale
When applying this method across North-South divides, valuers must establish regional adjustment factors that account for the systematic premium commanded by Southern locations. A chartered surveyor in North London might apply a 60-80% adjustment when comparing to Northern equivalents, while a surveyor in South West London might apply 150-180% adjustments.
Challenges in Regional Comparable Analysis
The comparable method faces several critical limitations when addressing North-South gaps:
Limited transaction evidence: Secondary markets, particularly in Northern regions, may experience infrequent sales, constraining the ability to establish reliable benchmarks [2]. A valuer might find only 3-5 comparable sales in a 12-month period for specialized properties, compared to 20-30 in Southern equivalents.
Lack of current data: Rapidly changing market conditions mean that comparables from 6-12 months ago may not reflect current values [2]. In volatile 2026 markets, this challenge intensifies, particularly where Northern outperformance contradicts historical trends.
Special purchaser distortion: The existence of special purchasers who pay above-market prices due to unique circumstances can distort regional valuations [2]. These transactions must be identified and excluded or adjusted to prevent skewing the valuation baseline.
The Income Approach: Investment Value Analysis
The income approach converts anticipated future income streams into present value, making it essential for investment properties, commercial assets, and rental portfolios. This method proves particularly valuable when comparable evidence is limited.
Application in Regional Contexts
Income-based valuations require careful consideration of regional yield differences. Northern properties typically offer higher gross yields (6-8%) compared to Southern equivalents (3-5%), reflecting different risk perceptions and growth expectations.
The income approach involves:
- Establishing market rent: Determining achievable rental income based on regional market conditions
- Selecting appropriate yield: Applying regionally-adjusted capitalization rates
- Accounting for voids and costs: Adjusting for regional differences in tenant demand and management expenses
- Calculating present value: Converting income stream to capital value
For capital gains tax valuations and investment assessments, the income approach provides crucial insights into relative value across regions, often revealing that Northern properties offer superior returns despite lower capital values.
The Cost Approach: Depreciated Replacement Cost
The cost approach estimates value based on the cost of acquiring equivalent land and constructing a substitute property, less depreciation. This method suits specialized properties rarely sold on open markets [2].
Regional Construction Cost Variations
Construction costs vary significantly across regions, though not proportionally to property values:
- Southern England: £1,800-£2,500 per square meter
- Northern England: £1,400-£1,900 per square meter
The depreciated replacement cost (DRC) method proves particularly useful for owner-occupied properties, specialized commercial assets, and insurance reinstatement valuations where comparable evidence is limited. When applying DRC across regions, valuers must adjust for local labor costs, material availability, and regulatory differences.
The Residual Method for Development Potential
The residual valuation method specifically addresses properties with development potential, requiring valuers to assess highest and best use [2]. This approach proves invaluable for identifying regional investment opportunities where North-South valuations diverge significantly.
The residual method calculation:
Gross Development Value (completed project value)
minus Development Costs (construction, fees, finance)
minus Developer's Profit (risk-adjusted return)
equals Residual Land Value
Regional variations affect every component of this calculation, with Southern developments commanding higher GDV but also incurring greater costs and requiring larger profit margins to justify risk.
Implementing Adjustment Methodologies for North-South Valuations

Successfully applying Valuation Techniques for Widening North-South Price Gaps: RICS Strategies for Accurate 2026 Regional Assessments requires systematic adjustment methodologies that account for regional differences while maintaining professional standards.
Developing Regional Adjustment Matrices
Professional valuers should develop regional adjustment matrices that quantify location premiums across multiple dimensions:
| Adjustment Factor | Northern Baseline | Southern Premium |
|---|---|---|
| Core Location | 100% | +150-200% |
| Transport Links | 100% | +15-25% |
| School Quality | 100% | +10-20% |
| Employment Access | 100% | +20-35% |
| Amenity Quality | 100% | +10-15% |
| Investment Demand | 100% | +25-40% |
These matrices should be updated quarterly based on transaction evidence and market intelligence. Valuation factors must be documented transparently to support professional defensibility.
Addressing Limited Transaction Evidence
When comparable evidence is scarce, valuers should employ multiple strategies:
Expand geographic search parameters: Widen the search radius while applying appropriate location adjustments. A Northern property might require comparables from 15-20 miles, versus 2-5 miles in dense Southern markets.
Extend time horizon: Consider transactions from 12-18 months with time adjustments for market movement. Apply regional-specific growth rates rather than national averages.
Cross-reference multiple approaches: Validate comparable-based valuations against income and cost approaches to ensure consistency and identify potential outliers.
Utilize market intelligence: Supplement transaction data with asking prices, withdrawn listings, and market reports to understand current conditions.
Managing Special Purchaser Effects
Special purchasers who pay premiums due to unique circumstances can significantly distort regional valuations [2]. These might include:
- Neighboring owners seeking to expand
- Developers assembling sites
- Buyers with specific personal connections
- Corporate relocations with urgency
To manage these effects:
✅ Identify special circumstances: Review transaction details to identify non-market factors
✅ Adjust or exclude: Either apply downward adjustments (typically 10-20%) or exclude from comparable set
✅ Document reasoning: Clearly explain why transactions were adjusted or excluded
✅ Seek additional evidence: Increase sample size to dilute special purchaser impact
Overcoming Market Transparency Limitations
Limited market transparency across regional markets hampers consistent valuation methodology [2]. Northern markets often suffer from less comprehensive transaction reporting, fewer published market analyses, and limited professional market intelligence.
Strategies to improve transparency include:
🔍 Build regional networks: Develop relationships with local agents, surveyors, and property professionals
🔍 Subscribe to regional data services: Invest in specialized databases covering secondary markets
🔍 Conduct market research: Undertake primary research through agent interviews and market surveys
🔍 Document market conditions: Create detailed market commentary supporting valuation assumptions
Sensitivity Analysis for Regional Valuations
Given the uncertainty inherent in North-South comparisons, sensitivity analysis becomes essential. This involves testing how valuation conclusions change with different assumptions:
Best case scenario: Apply lower regional adjustment factors (e.g., 140% instead of 160%)
Base case scenario: Use most probable adjustment factors based on available evidence
Worst case scenario: Apply higher adjustment factors (e.g., 180% instead of 160%)
This analysis should be presented in Red Book valuation reports to provide clients with a comprehensive understanding of valuation uncertainty and regional market dynamics.
Practical Application: Case Studies in Regional Valuation
Case Study 1: Residential Semi-Detached Properties
Northern Property (Manchester suburb):
- 3 bedrooms, 1,100 sq ft
- Built 1930s, modernized
- Good local schools, 20 minutes to city center
- Valuation: £265,000
Southern Equivalent (Surrey):
- 3 bedrooms, 1,100 sq ft
- Built 1930s, similar condition
- Comparable schools, 35 minutes to London
- Valuation: £625,000
Regional premium: 136% (£360,000 difference)
The valuer applied comparable evidence from both regions, adjusting for:
- Core location premium: +120%
- Transport infrastructure: +10%
- Employment market access: +15%
- Investment demand: -9% (adjustment for longer commute)
Case Study 2: Commercial Office Space
Northern Property (Leeds city center):
- 5,000 sq ft Grade A office
- Modern specification, excellent condition
- Rental value: £25 per sq ft
- Yield: 6.5%
- Capital value: £1,923,000
Southern Equivalent (Reading):
- 5,000 sq ft Grade A office
- Similar specification and condition
- Rental value: £42 per sq ft
- Yield: 4.75%
- Capital value: £4,421,000
Regional premium: 130% (£2,498,000 difference)
The income approach revealed that despite lower capital values, the Northern property delivered superior returns, highlighting the importance of applying multiple valuation methods when assessing regional opportunities.
Addressing Common Challenges in Regional Valuations
Challenge 1: Outdated Comparable Evidence
In rapidly evolving markets, comparables from even six months ago may not reflect current conditions [2]. This proves particularly problematic when Northern markets outperform while Southern markets stagnate—a scenario contradicting historical patterns.
Solutions:
- Apply time adjustments based on regional house price indices
- Weight recent transactions more heavily
- Supplement with current asking prices and offer data
- Conduct agent interviews to understand market sentiment
Challenge 2: Lack of Directly Comparable Properties
Regional markets often lack truly comparable properties, particularly for unique or specialized assets.
Solutions:
- Use the unit of comparison method (price per square foot/meter) with appropriate adjustments
- Apply the residual method to assess development potential independently
- Consider the profits method for trading properties based on business performance
- Employ DRC for specialized properties without market comparables
Challenge 3: Market Bifurcation Effects
The RICS Monitor identifies widening gaps between prime and secondary assets as a defining 2026 characteristic [3]. This bifurcation occurs within regions as well as between them, creating sub-markets with distinct dynamics.
Solutions:
- Clearly define property classification (prime/secondary/tertiary)
- Develop separate adjustment matrices for each market tier
- Avoid cross-tier comparisons without substantial adjustments
- Document market tier justification in valuation reports
Challenge 4: Conflicting Market Signals
January 2026 data showing Northern outperformance versus Southern stagnation creates conflicting signals that challenge traditional North-South assumptions.
Solutions:
- Focus on forward-looking indicators rather than historical patterns
- Consider economic fundamentals driving regional performance
- Apply scenario analysis testing different market trajectories
- Clearly communicate market uncertainty in valuation reports
Professional Standards and Compliance for Regional Valuations
RICS Red Book Requirements
All valuations must comply with RICS Global Valuation Standards (Red Book), which establish mandatory practices for professional valuation services:
📋 Terms of engagement: Clear scope, purpose, and basis of valuation
📋 Competence and objectivity: Appropriate expertise and independence
📋 Inspection and investigation: Adequate property inspection and due diligence
📋 Valuation approach: Appropriate methodology with clear reasoning
📋 Reporting: Comprehensive documentation of process and conclusions
When addressing regional disparities, valuers must pay particular attention to:
- Assumptions and special assumptions: Clearly stating any assumptions about market conditions or property characteristics
- Departures from standards: Documenting any necessary departures with justification
- Uncertainty and sensitivity: Acknowledging valuation uncertainty and providing sensitivity analysis
- Market commentary: Including detailed regional market analysis supporting conclusions
Documentation and Defensibility
Given the complexity of Valuation Techniques for Widening North-South Price Gaps: RICS Strategies for Accurate 2026 Regional Assessments, thorough documentation becomes essential:
✍️ Comparable evidence schedule: Detailed record of all comparables considered, including those rejected
✍️ Adjustment calculations: Transparent methodology for all adjustments applied
✍️ Market research: Documentation of market intelligence and research undertaken
✍️ Alternative approaches: Results from multiple valuation methods for validation
✍️ Sensitivity analysis: Range of values under different assumptions
This documentation protects professional liability and provides clients with confidence in the valuation process, particularly important for divorce valuations and other contentious situations.
Continuing Professional Development
The evolving nature of regional markets demands ongoing professional development. RICS members should:
- Attend regional market briefings and seminars
- Subscribe to market intelligence services covering both Northern and Southern markets
- Participate in peer review and calibration exercises
- Stay current with updates to International Valuation Standards (IVS) affecting 2026 Global Valuation Standards [2]
- Develop expertise in specialized valuation methods relevant to regional work
Technology and Data Analytics in Regional Valuation
Automated Valuation Models (AVMs)
AVMs use statistical modeling and property databases to generate valuations. While useful for high-level assessments, they face limitations in addressing North-South disparities:
Advantages:
- Rapid valuations for large portfolios
- Consistent methodology across regions
- Objective, data-driven approach
Limitations:
- Struggle with unique properties or limited data
- May not capture subtle regional market dynamics
- Require professional oversight and validation
Professional valuers should use AVMs as a starting point rather than final conclusion, particularly when significant regional adjustments are required.
Geographic Information Systems (GIS)
GIS technology enables sophisticated spatial analysis of regional markets:
- Heat mapping: Visualizing price gradients across regions
- Proximity analysis: Quantifying impact of transport links, schools, amenities
- Market segmentation: Identifying micro-markets within broader regions
- Trend analysis: Tracking regional performance over time
Big Data and Market Intelligence
Advanced data analytics platforms aggregate multiple data sources to provide comprehensive market intelligence:
- Transaction databases with regional filtering
- Rental market data and yield analysis
- Economic indicators and employment statistics
- Demographic trends and migration patterns
- Infrastructure investment tracking
These tools enable valuers to develop robust regional adjustment factors based on objective data rather than subjective judgment alone.
Future Outlook: Regional Valuation in 2026 and Beyond
Emerging Trends Affecting Regional Valuations
Several trends will continue shaping Valuation Techniques for Widening North-South Price Gaps: RICS Strategies for Accurate 2026 Regional Assessments:
🔮 Leveling Up initiatives: Government infrastructure investment in Northern regions may narrow gaps, though effects remain uncertain
🔮 Remote work evolution: Continued workplace flexibility may support Northern markets while Southern premiums persist for lifestyle reasons
🔮 Sustainability premiums: Energy efficiency and environmental standards may affect regions differently based on housing stock age and type
🔮 Demographic shifts: Aging population and changing household formation patterns will impact regional demand differently
Adapting Valuation Techniques
Professional valuers must remain agile, adapting techniques as regional dynamics evolve:
- Quarterly market reviews: Regular reassessment of regional adjustment factors
- Scenario planning: Developing multiple market trajectory scenarios
- Cross-regional collaboration: Sharing intelligence between Northern and Southern practitioners
- Methodology innovation: Developing new techniques for emerging market conditions
Professional Opportunities
The widening North-South gap creates opportunities for specialist valuers who develop deep regional expertise. Professionals who can confidently navigate these disparities will find strong demand for services including:
- Portfolio valuations spanning multiple regions
- Investment advisory for cross-regional acquisitions
- Expert witness services for disputes involving regional comparisons
- Strategic advice on regional investment allocation
Conclusion
The widening North-South property price gap represents one of the most significant challenges facing RICS-registered valuers in 2026. With Southern properties commanding premiums of 150-200% over Northern equivalents, traditional valuation approaches require careful adaptation and sophisticated adjustment methodologies.
Successful navigation of these regional disparities demands:
✅ Mastery of multiple valuation approaches: Market, income, and cost methods each provide crucial insights when applied with regional sensitivity
✅ Robust adjustment methodologies: Systematic frameworks for quantifying location premiums and regional differences
✅ Comprehensive market intelligence: Deep understanding of both Northern and Southern market dynamics, supported by data analytics
✅ Professional rigor: Strict adherence to RICS Red Book standards with thorough documentation and transparency
✅ Ongoing adaptation: Continuous professional development and methodology refinement as markets evolve
The surprising January 2026 data showing Northern outperformance versus Southern stagnation underscores the importance of evidence-based valuation rather than relying on historical assumptions. Professional valuers must remain objective, data-driven, and methodologically rigorous while acknowledging the inherent uncertainty in regional assessments.
Actionable Next Steps
For property professionals seeking to enhance their regional valuation capabilities:
- Develop regional expertise: Build deep knowledge of specific Northern and Southern markets through research, networking, and continuing education
- Create adjustment frameworks: Establish documented methodologies for regional adjustments, updated quarterly based on transaction evidence
- Invest in technology: Leverage GIS, data analytics, and market intelligence platforms to support evidence-based valuations
- Enhance documentation: Implement comprehensive documentation practices that ensure professional defensibility
- Seek specialist support: Partner with chartered surveyors who possess deep regional expertise when valuing properties outside your primary market area
The complexity of regional valuation in 2026 demands the highest standards of professional practice. By applying RICS-approved methodologies with regional sensitivity, maintaining rigorous documentation, and staying current with evolving market dynamics, valuers can deliver accurate, defensible assessments that serve their clients and uphold professional standards—regardless of whether properties sit in Northern or Southern markets.
References
[1] Valuing North Vs South Uk Properties In 2026 Surveyor Techniques For Diverging Regional Markets – https://nottinghillsurveyors.com/blog/valuing-north-vs-south-uk-properties-in-2026-surveyor-techniques-for-diverging-regional-markets
[2] Apc 5 Valuation Methods – https://ww3.rics.org/uk/en/journals/property-journal/apc-5-valuation-methods.html
[3] Rics Monitor Why 2026 Is A Market Of Specific Opportunities – https://www.commercialsearch.com/news/rics-monitor-why-2026-is-a-market-of-specific-opportunities/