
The London property market faces its steepest decline in recent memory, with February 2026 data revealing a shocking -40% net balance that has sent shockwaves through the valuation profession. While national headlines suggest relative price stability, the reality beneath the surface tells a dramatically different story—one where southern markets are experiencing severe pressure while northern regions surge ahead. For chartered surveyors and property professionals, Valuation Adjustments for London Price Slumps: RICS Strategies Against -40% Net Balances in 2026 Southern Markets has become an urgent priority, requiring sophisticated techniques to reconcile these regional disparities and deliver accurate, defensible appraisals in an increasingly fragmented market.
The challenge facing valuers in 2026 extends far beyond simple price adjustments. With buyer enquiries collapsing to -26%, mortgage affordability continuing to constrain demand, and geopolitical uncertainty dampening confidence, professional surveyors must navigate unprecedented complexity[1]. This article explores the evidence-based strategies RICS professionals are deploying to maintain valuation accuracy amid London's historic downturn.

Key Takeaways
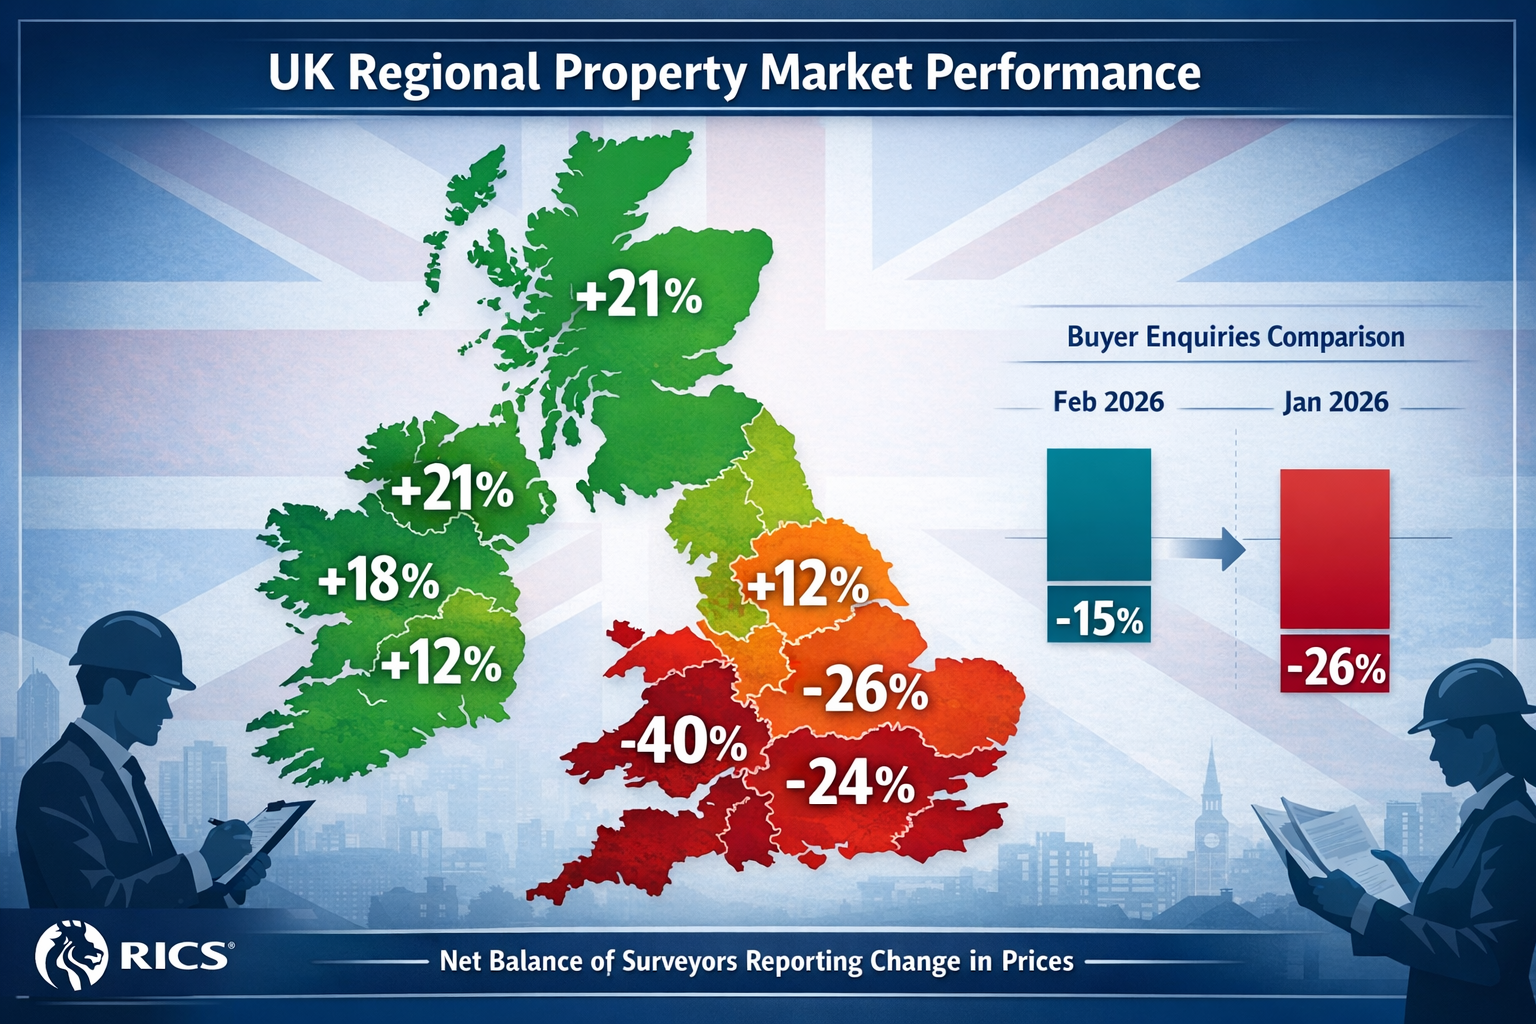
- 📉 London's -40% net balance represents the steepest regional decline, significantly outpacing the South East (-24%) and East Anglia (-26%) in February 2026
- 🔍 Regional adjustment techniques are essential as flat national averages mask dramatic north-south divergence, with Manchester up 8.2% year-on-year
- 📊 RICS Red Book compliance requires enhanced market evidence analysis and transparent adjustment documentation for southern market valuations
- 💡 First-time buyer segments show early recovery signs despite broader challenges, requiring nuanced valuation approaches
- ⚠️ Long-term confidence has collapsed, with 12-month price expectations plummeting from +56% to just +7% in London markets
Understanding the -40% Net Balance: What the February 2026 Data Reveals
The Royal Institution of Chartered Surveyors (RICS) February 2026 Residential Market Survey delivered sobering news for London property professionals. The capital's -40% net balance indicates that four times as many surveyors reported price declines as reported increases—a level of pessimism not seen since the depths of previous market corrections[1].
Breaking Down the Regional Performance Gap
The data reveals a stark geographical divide that challenges traditional valuation methodologies:
| Region | Net Balance (Feb 2026) | Change from Jan 2026 | Year-on-Year Trend |
|---|---|---|---|
| London | -40% | Significant decline | Sharply negative |
| South East | -24% | Deteriorating | Negative |
| East Anglia | -26% | Worsening | Negative |
| Manchester/North | Positive territory | Improving | +8.2% YoY growth[2] |
This divergence creates immediate challenges for property valuation professionals who must justify their figures against both regional and national benchmarks.
The Confidence Collapse: From Optimism to Caution
Perhaps most concerning is the dramatic shift in forward-looking expectations. London's 12-month price outlook collapsed from +56% to merely +7%—an 87% reduction in confidence that signals deep structural concerns beyond cyclical fluctuations[1]. This psychological shift affects:
- Buyer decision-making timelines (increased hesitancy)
- Vendor pricing expectations (slower to adjust downward)
- Lender risk assessments (tighter lending criteria)
- Valuation uncertainty ranges (wider confidence intervals required)
Demand Indicators Paint a Bleak Picture
The February 2026 survey revealed buyer enquiries weakened considerably to a net balance of -26%, down from -15% in January[1]. This 73% deterioration in just one month suggests:
✅ Mortgage affordability constraints persist despite rate stabilization
✅ Geopolitical and macroeconomic uncertainty intensified
✅ Southern market buyers adopt "wait and see" strategies
✅ Transaction volumes remain subdued with agreed sales at -12%[1]
For valuers conducting Red Book valuations, these demand indicators must inform market conditions analysis and valuation assumptions.
RICS-Compliant Valuation Adjustments for London Price Slumps in 2026
When addressing Valuation Adjustments for London Price Slumps: RICS Strategies Against -40% Net Balances in 2026 Southern Markets, professional surveyors must balance technical rigor with practical market realities. The RICS Valuation – Global Standards (Red Book) provides the framework, but application requires nuanced judgment.
Enhanced Comparable Evidence Analysis
Traditional comparable sales analysis faces significant challenges in rapidly declining markets. Best practice adjustments include:
Time-Based Adjustments
- Apply monthly depreciation factors reflecting the -40% net balance trajectory
- Weight recent transactions (last 30-60 days) more heavily than older comparables
- Adjust for the velocity of decline, not just absolute price changes
- Document market conditions at each comparable's exchange date
Location Micro-Adjustments
The north-south divide extends to intra-London variations. Prime central London and outer boroughs experience different decline rates, requiring:
- Postcode-level performance analysis
- Transport link proximity adjustments (areas near Elizabeth Line showing resilience)
- School catchment premium recalibration
- Neighborhood-specific demand indicators
Professional surveyors offering valuation services in South West London must recognize that even within London, performance varies significantly.
Reconciling National vs. Regional Data
One of the most challenging aspects of Valuation Adjustments for London Price Slumps: RICS Strategies Against -40% Net Balances in 2026 Southern Markets involves explaining to clients why their property value differs from national headlines suggesting stability.
Transparent Documentation Strategies:
📝 Market Context Statements – Include explicit regional performance data in valuation reports
📝 Dual Benchmarking – Reference both national and London-specific indices
📝 Trend Analysis Graphs – Visual representation of divergence between regions
📝 Assumption Clarity – State explicitly which market indicators informed the valuation
For specialized valuations such as divorce property valuations or probate valuations, this transparency becomes legally critical.
Adjusting for Market Liquidity and Time on Market
The -40% net balance correlates with extended marketing periods and increased price negotiation. Valuation adjustments should reflect:
- Liquidity premiums for properties likely to sell quickly (first-time buyer segment)
- Holding cost considerations for properties facing extended marketing
- Negotiation discounts reflecting buyer leverage in weak markets
- Conditional offer risks where buyers increasingly include survey-dependent clauses
Forward-Looking Valuation Scenarios
Given the collapse in 12-month expectations from +56% to +7%[1], many clients require scenario-based valuations rather than single-point estimates:
| Scenario | Probability | Valuation Range | Key Assumptions |
|---|---|---|---|
| Continued Decline | 40% | -5% to -10% further | Mortgage rates remain elevated, recession materializes |
| Stabilization | 35% | Flat to +2% | Rates stabilize, uncertainty reduces |
| Recovery | 25% | +3% to +7% | Rate cuts, improved affordability, confidence returns |
This approach, while more complex, provides clients with realistic expectations and protects valuers from hindsight criticism.
Regional Divergence: Tailoring Valuation Strategies for Southern vs. Northern Markets

The widening north-south valuation divide represents one of the most significant challenges for national firms and portfolio valuers in 2026. Manchester's +8.2% year-on-year growth stands in stark contrast to London's decline, creating methodological challenges for consistent valuation approaches[2].
Understanding the Structural Drivers of Divergence
The regional split isn't merely cyclical—it reflects fundamental structural shifts:
Affordability Dynamics
- Northern markets offer price-to-income ratios 40-50% lower than London
- First-time buyers priced out of southern markets find accessibility in the North
- Remote work flexibility enables geographic arbitrage
- Lifestyle preferences shifting toward affordability over proximity to London
Economic Performance Variations
- Manchester and northern cities benefit from infrastructure investment (HS2, Northern Powerhouse)
- London faces financial services headwinds and post-Brexit adjustments
- Regional employment growth rates favor northern cities
- Cost-of-living pressures hit southern homeowners harder
Valuation Methodology Adaptations by Region
Professional surveyors must calibrate their approaches based on regional dynamics:
For London and Southern Markets:
- ⚠️ Apply conservative growth assumptions (0-2% annually)
- ⚠️ Increase comparable evidence recency requirements (30-60 days maximum)
- ⚠️ Weight distressed sales and forced transactions appropriately
- ⚠️ Incorporate extended marketing period assumptions (90-120 days vs. historical 60 days)
- ⚠️ Consider "hope value" discounts for properties requiring renovation
For Northern and Midlands Markets:
- ✅ Recognize positive momentum in comparable selection
- ✅ Account for infrastructure improvement premiums
- ✅ Adjust for inward migration demand factors
- ✅ Consider tighter supply constraints driving competition
- ✅ Apply shorter marketing period assumptions reflecting demand strength
For firms operating across regions, such as those offering chartered surveyor services across London, maintaining consistent standards while adapting to local conditions requires robust quality control.
Portfolio Valuation Challenges
Institutional investors and portfolio landlords face particular challenges when holdings span multiple regions. Best practice portfolio valuation in 2026 requires:
Stratified Sampling Approaches
- Separate London/South East properties from northern holdings
- Apply region-specific valuation methodologies
- Weight portfolio conclusions appropriately by geographic exposure
- Report regional performance separately rather than blended averages
Risk-Adjusted Valuation Ranges
Given the -40% net balance in London, portfolio valuations should incorporate wider uncertainty ranges for southern holdings:
- London properties: ±7-10% valuation uncertainty range
- Northern properties: ±4-6% valuation uncertainty range
- National portfolio: Weighted average uncertainty reflecting geographic mix
This approach provides commercial valuation clients with realistic risk assessments.
The First-Time Buyer Segment: A Silver Lining
Despite the broader challenges, the first-time buyer segment shows early recovery signs[1]. This creates valuation opportunities and considerations:
Properties Appealing to First-Time Buyers:
- Smaller flats and starter homes (1-2 bedrooms)
- Properties near £250,000-£350,000 threshold (stamp duty considerations)
- Areas with strong transport links to employment centers
- Neighborhoods with improving amenities and schools
These properties may experience relative outperformance compared to the broader London market, warranting premium adjustments of 2-5% compared to comparable larger properties.
Surveyors conducting Help to Buy valuations should particularly note this segment's resilience.
Technical Considerations for RICS Valuation Reports in Declining Markets
Producing defensible valuation reports in the context of Valuation Adjustments for London Price Slumps: RICS Strategies Against -40% Net Balances in 2026 Southern Markets requires enhanced technical rigor.
Market Evidence Documentation Requirements
The RICS Red Book emphasizes adequate and relevant market evidence. In declining markets, this means:
Quantity of Comparables
- Minimum 6-8 comparable transactions (vs. 3-5 in stable markets)
- Include both completed sales and current listings to show asking vs. achieved prices
- Document withdrawn listings to demonstrate market resistance at certain price points
- Reference auction results for distressed sale context
Quality of Evidence Analysis
- Detailed commentary on each comparable's relevance and adjustments applied
- Explicit discussion of market conditions at each transaction date
- Transparent explanation of time adjustments methodology
- Geographic proximity justification (why certain comparables were selected)
Market Conditions Addendum
Given the volatility, many valuers now include a dedicated market conditions section covering:
- Recent RICS survey data (citing the -40% net balance explicitly)[1]
- Regional performance context (north-south divide)[2]
- Demand indicators (buyer enquiries, agreed sales trends)
- Forward-looking indicators (mortgage approvals, confidence measures)
- Macroeconomic factors (interest rate outlook, inflation, employment)
Valuation Uncertainty and Confidence Intervals
The RICS Red Book allows valuers to express material valuation uncertainty when market conditions warrant. In February 2026, London market conditions clearly meet this threshold.
Appropriate Uncertainty Language:
"Given the significant market volatility evidenced by the -40% RICS net balance for London in February 2026, and the collapse in forward-looking confidence from +56% to +7%, this valuation is subject to material uncertainty. The valuation should be understood as representing the most probable price within a range of ±8% under current market conditions."
This approach protects valuers while providing clients with realistic expectations.
Special Purpose Valuations in Declining Markets
Certain valuation purposes require particular care during market downturns:
Capital Gains Tax Valuations
Capital gains tax valuations for disposals in early 2026 must carefully establish market value at disposal date, potentially requiring retrospective analysis if the valuation is commissioned months later.
Matrimonial Valuations
Divorce property valuations face particular scrutiny in declining markets, as both parties may dispute whether current market weakness is temporary or structural.
Probate and Estate Valuations
Probate valuations require precise date-of-death valuations, which may differ significantly from current values if the death occurred months earlier during a different market phase.
Shared Ownership and Leasehold Valuations
Shared ownership valuations and freehold valuations must account for how market declines affect both the property value and the lease extension/enfranchisement calculations.
Practical Implementation: Case Studies and Examples
Case Study 1: Prime London Flat Valuation
Property: Two-bedroom flat, Zone 2, South West London
Challenge: Comparable sales from 6 months ago show £650,000; current listings at £595,000 with no sales
RICS Strategy Applied:
- Time adjustment: Applied -2% monthly decline = -12% over 6 months
- Adjusted comparable: £650,000 × 0.88 = £572,000
- Current listing analysis: £595,000 asking prices suggest vendors not yet accepting reality
- Final valuation: £575,000 (midpoint, recognizing listings will likely reduce)
- Uncertainty range: £555,000-£595,000 (±3.5%)
This approach, documented transparently in the valuation report, provides defensible reasoning.
Case Study 2: First-Time Buyer Property Outperformance
Property: One-bedroom flat, outer London, excellent transport links
Challenge: Broader market down -40% net balance, but this segment showing resilience
RICS Strategy Applied:
- Segment-specific analysis: Identified property as first-time buyer target
- Demand indicators: Local estate agents report strong enquiries for this property type
- Comparable selection: Focused on similar first-time buyer properties, not broader market
- Premium adjustment: Applied +3% premium vs. general market comparables
- Justification: Cited RICS data showing first-time buyer segment recovery[1]
This demonstrates how Valuation Adjustments for London Price Slumps: RICS Strategies Against -40% Net Balances in 2026 Southern Markets must be nuanced, not blanket.
Case Study 3: Portfolio Valuation with Geographic Spread
Portfolio: 50 properties across London, Manchester, and Birmingham
Challenge: Reconciling -40% London net balance with +8.2% Manchester growth[2]
RICS Strategy Applied:
- Regional stratification: Separated portfolio into three geographic tranches
- Region-specific methodologies: Applied declining market adjustments to London holdings, growth assumptions to northern properties
- Weighted portfolio conclusion: 60% London (declining), 25% Manchester (growing), 15% Birmingham (stable)
- Risk reporting: Highlighted concentration risk in underperforming London market
- Scenario analysis: Provided three portfolio value scenarios based on regional performance variations
This approach provides institutional clients with actionable intelligence for portfolio management decisions.
Looking Ahead: Market Recovery Indicators and Valuation Strategy Evolution
While the February 2026 data paints a challenging picture, professional valuers must also monitor early indicators of potential recovery or further decline.
Key Indicators to Monitor
Leading Indicators (3-6 months forward-looking):
- 📊 Mortgage approval volumes (Bank of England data)
- 📊 New buyer enquiry trends (monthly RICS surveys)
- 📊 Interest rate trajectory and market expectations
- 📊 First-time buyer activity levels
- 📊 New instruction volumes (supply indicators)
Coincident Indicators (current market state):
- 📊 Agreed sales net balance
- 📊 Time on market statistics
- 📊 Price reduction frequency and magnitude
- 📊 Auction success rates
- 📊 Rental yield compression or expansion
Lagging Indicators (confirming trends):
- 📊 Completed transaction volumes (Land Registry)
- 📊 House price indices (Nationwide, Halifax, ONS)
- 📊 Repossession statistics
- 📊 Rental market performance
Adapting Valuation Strategies as Markets Evolve
As 2026 progresses, valuers must remain agile in methodology while maintaining RICS compliance:
If Markets Stabilize:
- Gradually extend comparable evidence timeframes from 30-60 days back to 90 days
- Reduce uncertainty ranges from ±8% back toward ±5%
- Moderate time-based decline adjustments
- Restore confidence in forward-looking assumptions
If Decline Accelerates:
- Further tighten comparable recency requirements (30 days maximum)
- Expand uncertainty ranges to ±10% or more
- Consider formal "material uncertainty" declarations
- Increase scenario analysis provision to clients
If North-South Divide Widens:
- Develop distinct regional valuation frameworks
- Enhance geographic adjustment sophistication
- Consider separate fee structures reflecting complexity
- Invest in regional market intelligence capabilities
The Role of Technology and Data Analytics
Modern valuation practice increasingly leverages data analytics and technology to navigate complex markets:
Automated Valuation Models (AVMs)
- Useful for initial estimates and portfolio screening
- Limitations in volatile markets: AVMs struggle with rapid changes and regional divergence
- Best practice: Use AVMs as starting points, not final conclusions
- Human expertise remains essential for adjustments and judgment
Market Intelligence Platforms
- Real-time transaction data feeds
- Sentiment analysis from property portals
- Predictive analytics for market trends
- Enhanced comparable evidence sourcing
Geospatial Analysis
- Heat mapping of price performance
- Transport accessibility modeling
- Demographic overlay analysis
- Micro-market identification
Professional surveyors who combine traditional RICS methodology with modern data capabilities will deliver the most accurate valuations in challenging markets.
Conclusion
The Valuation Adjustments for London Price Slumps: RICS Strategies Against -40% Net Balances in 2026 Southern Markets represent one of the most significant challenges facing property professionals in recent memory. The February 2026 RICS data reveals a market in substantial distress, with London's -40% net balance, collapsed buyer enquiries at -26%, and forward confidence plummeting from +56% to just +7%[1].
Yet within this challenging environment lies opportunity for professional surveyors who adapt their methodologies appropriately. By implementing enhanced comparable evidence analysis, applying transparent regional adjustments, documenting market uncertainty appropriately, and maintaining rigorous RICS Red Book compliance, valuers can deliver accurate, defensible appraisals that serve their clients' needs.
The widening north-south divide, with Manchester showing +8.2% growth while London declines[2], demands sophisticated regional calibration rather than one-size-fits-all approaches. The emerging resilience in the first-time buyer segment provides a silver lining and demonstrates the importance of granular market analysis.
Actionable Next Steps for Property Professionals
✅ Review and update comparable evidence databases monthly, not quarterly
✅ Implement region-specific valuation templates reflecting local market conditions
✅ Enhance market conditions documentation in all valuation reports
✅ Consider material uncertainty declarations for London and southern market valuations
✅ Invest in continuous professional development focused on declining market valuation techniques
✅ Develop client communication materials explaining regional divergence
✅ Monitor RICS monthly survey data and adjust methodologies accordingly
For property owners, investors, and institutions operating in London and southern markets, engaging qualified chartered surveyors with expertise in declining market valuation has never been more critical. The difference between accurate valuation and over- or under-valuation can mean tens of thousands of pounds in transaction outcomes, tax liabilities, or settlement negotiations.
As 2026 unfolds, the property professionals who combine technical RICS expertise with market intelligence, regional sophistication, and transparent client communication will navigate these challenging waters successfully—delivering valuations that stand up to scrutiny while serving their clients' best interests in an unprecedented market environment.
References
[1] Uk Residential Survey February 2026 – https://www.rics.org/news-insights/uk-residential-survey-february-2026
[2] Navigating Widening North South Valuation Divides In 2026 Rics Techniques For Accurate Property Appraisals – https://nottinghillsurveyors.com/blog/navigating-widening-north-south-valuation-divides-in-2026-rics-techniques-for-accurate-property-appraisals
[3] Uk Resi Survey Jan 2026 Report Shows Early Signs Market Recovery Despite Caution – https://www.rics.org/news-insights/uk-resi-survey-jan-2026-report-shows-early-signs-market-recovery-despite-caution