The property market is experiencing a fundamental shift in 2026, and surveyors who ignore it risk providing outdated valuations. For the first time in years, first-time buyer purchasing power is genuinely improving across major markets, with income requirements dropping by 4% nationally and mortgage lenders loosening lending criteria [1]. This isn't just another market fluctuation—it represents a structural change in affordability that demands new valuation protocols.
Traditional comparable analysis methods, built for price-driven inflation markets, struggle to capture genuine affordability improvements. When buyer spending power fundamentally changes through better loan-to-income ratios and expanded lending criteria, surveyors must recalibrate their assessment frameworks to reflect real market dynamics rather than historical price trends alone.

Key Takeaways
- Income requirements have decreased 4% nationally, with Americans now needing $111,252 to afford the typical home compared to $115,870 a year ago, creating expanded buyer pools in 37 of the 50 largest metro areas [1]
- Regional variations demand localized adjustments, with Dallas showing 7.4% improvement, Sacramento 6.8%, and Jacksonville 5.9% year-over-year affordability gains [1]
- Builder price reductions signal market recalibration, with 40% of builders cutting prices by approximately 5% and nearly 20% of new homes facing Q4 2025 price cuts [5]
- Traditional valuation methods require updates to incorporate improved loan-to-income ratios, expanded lending criteria, and genuine purchasing power shifts rather than price-only analysis
- The affordability gap persists but is narrowing, with 65% of households still unable to afford median-priced homes, creating opportunities for targeted valuation adjustments in improving segments [2]
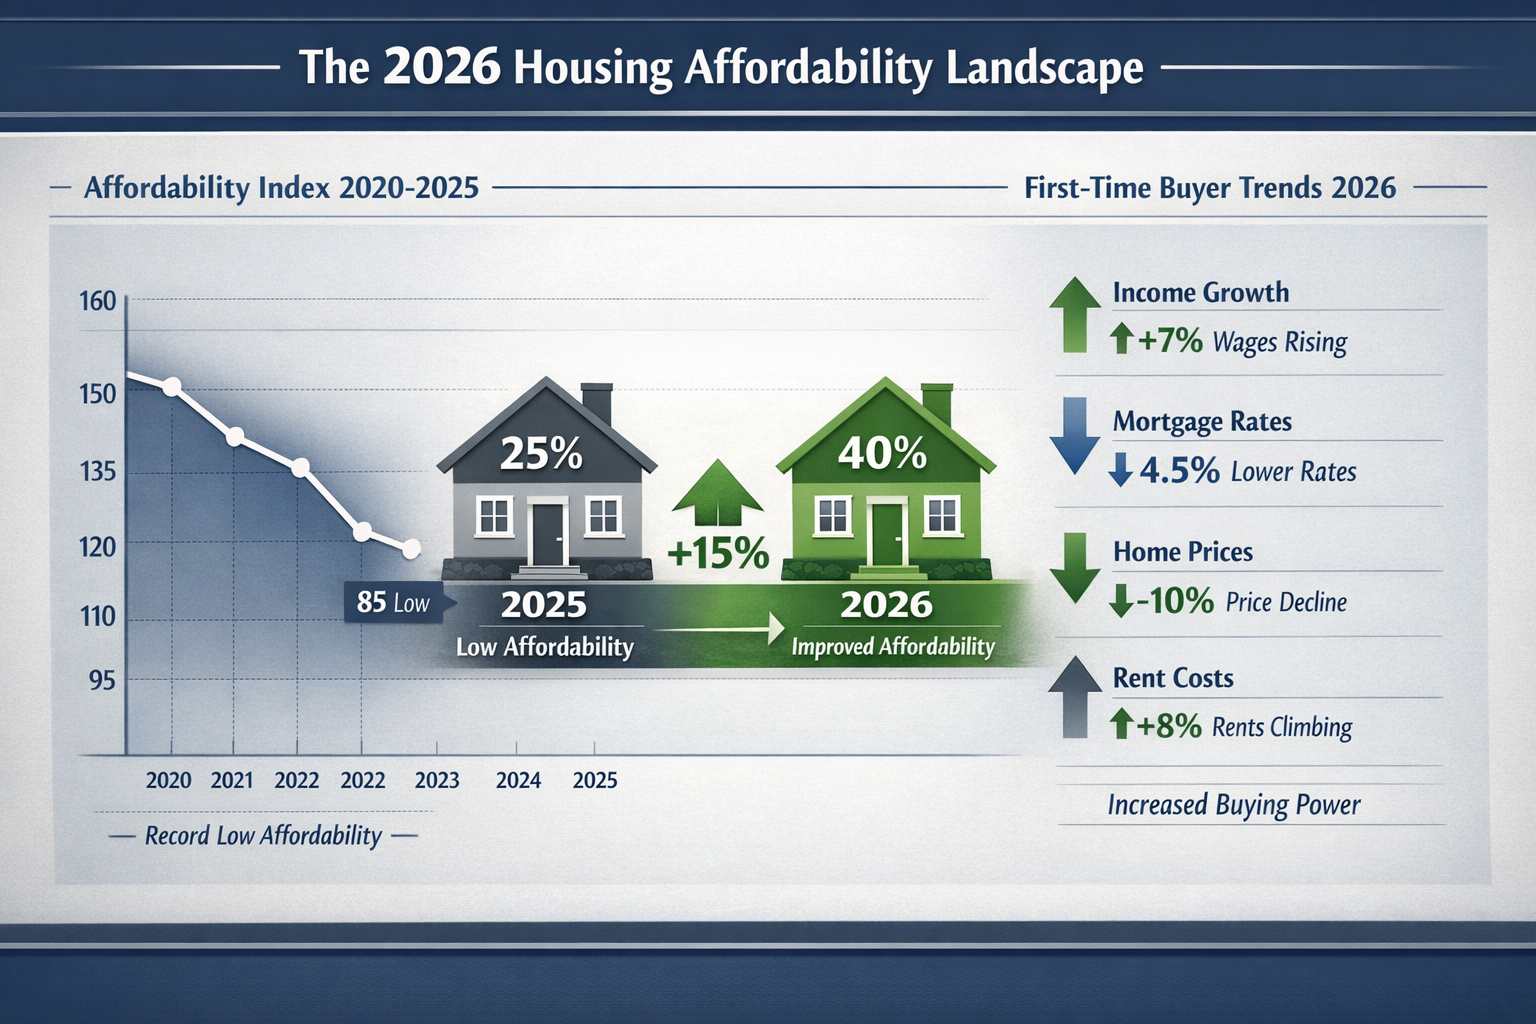
Understanding the 2026 Affordability Landscape and Its Impact on Valuations
The current market presents a paradox that challenges traditional valuation thinking. While 65% of U.S. households—approximately 88.2 million—still cannot afford a median-priced home at $413,595 with a 6% mortgage rate [2], the trajectory shows meaningful improvement for the first time in years. This creates a valuation environment where historical comparables may underestimate genuine buyer capacity in specific market segments.
The Mechanics of Improved Affordability
Several converging factors are reshaping buyer purchasing power in 2026:
Mortgage Rate Stabilization: After peaking above 7% in 2023-2024, rates have moderated to around 6%, directly improving monthly payment affordability and expanding the pool of qualified buyers [2].
Income Requirement Reductions: The typical income needed to purchase a median-priced home has dropped from $115,870 to $111,252—a $4,618 decrease that brings thousands of previously priced-out households into the market [1][7].
Lender Criteria Evolution: Financial institutions are gradually loosening debt-to-income ratio requirements and offering more flexible loan products, particularly for first-time buyers with strong employment histories but limited down payment capacity [3].
Builder Market Responses: Approximately 40% of builders reduced prices by an average of 5% in late 2025, with nearly 20% of new construction facing price cuts during Q4 [5]. This represents a fundamental market recalibration rather than distressed selling.
For RICS registered valuers in London and across the UK, these U.S. trends provide important signals about global affordability dynamics that may influence domestic markets as international investment patterns shift.
Regional Variation: The Critical Factor
National averages obscure dramatic regional differences that surveyors must incorporate into their assessments. Consider these year-over-year improvements in income requirements [1]:
| Metro Area | Income Requirement Change | Current Required Income |
|---|---|---|
| Dallas | -7.4% | $93,500 (estimated) |
| Sacramento | -6.8% | $108,200 (estimated) |
| Jacksonville | -5.9% | $87,600 (estimated) |
| National Average | -4.0% | $111,252 |
These variations reflect local employment trends, housing supply dynamics, and migration patterns. A surveyor conducting property valuations in London must understand comparable regional dynamics within Greater London, where areas like Richmond, Esher, and Kingston may show different affordability trajectories than central zones.
The First-Time Buyer Squeeze Continues
Despite improvements, the long-term trend remains challenging. First-time buyer share has plummeted from 44% in 1981 to just 21% in 2025 [4]. This creates a bifurcated market where:
- Established homeowners with equity benefit from refinancing opportunities and trading up
- First-time buyers remain constrained despite improvements, creating specific market segments with different valuation dynamics
- Investment buyers adjust strategies based on rental yield calculations influenced by tenant affordability
Surveyors must recognize which buyer segment dominates in specific property types and price ranges when selecting comparables and making adjustments.
Affordability-Driven Valuation Adjustments: Recalibrating Comparable Analysis Methods
Traditional comparable sales analysis relies heavily on recent transaction prices, with adjustments for property characteristics, location, and timing. This methodology works well in stable markets but struggles when fundamental affordability shifts change buyer capacity independent of property features.
Integrating Affordability Metrics into Valuation Protocols
Professional surveyors should incorporate these affordability-driven adjustments into their 2026 assessment frameworks:
1. Income-to-Price Ratio Analysis 📊
Rather than relying solely on price per square foot comparables, calculate the income-to-price ratio for both subject properties and comparables:
- Historical baseline: Determine the typical income required for properties in the subject's category over the past 3-5 years
- Current requirement: Calculate current income needed based on prevailing mortgage rates and lending criteria
- Adjustment factor: Apply positive adjustments when current requirements have decreased relative to historical norms
Example: If a property type historically required $120,000 income but now requires only $110,000 due to rate improvements, this represents an 8.3% affordability improvement that may support higher valuations than raw price comparables suggest.
2. Regional Affordability Indexing
Create location-specific affordability indices that track:
- Year-over-year changes in required income for median properties
- Local employment and wage growth trends
- Migration patterns (in-migration typically signals improving affordability perception)
- New construction activity and builder pricing strategies
Chartered surveyors in Surrey, Sussex, and Oxfordshire should develop regional indices reflecting local market conditions rather than applying national trends uniformly.
3. Buyer Demographic Weighting
Adjust comparable selection based on the likely buyer demographic for the subject property:
- First-time buyer properties (typically under £300,000 in most UK markets): Weight comparables heavily toward recent transactions where buyers benefited from improved lending criteria
- Move-up properties: Consider equity position of likely buyers and refinancing activity trends
- Investment properties: Factor tenant affordability and rental yield calculations
4. Lender Criteria Adjustment Factor
Track changes in lending standards that affect buyer qualification:
- Debt-to-income ratio relaxation: If lenders expand from 4.5x to 5x income multiples, this represents an 11% increase in borrowing capacity
- Down payment flexibility: Reduced deposit requirements expand the buyer pool significantly
- Credit score thresholds: Lowered minimum scores bring additional qualified buyers to market
Practical Application: The Comparable Selection Matrix
When selecting and adjusting comparables in 2026, surveyors should use this enhanced framework:
Step 1: Traditional Comparable Selection
- Identify 5-10 recent sales matching property type, size, condition, and location
- Make standard adjustments for property-specific differences
Step 2: Affordability Screening
- Calculate the income required to purchase each comparable at its sale date
- Determine if the transaction occurred during improving or declining affordability conditions
- Note any builder incentives, rate buydowns, or special financing that affected the sale
Step 3: Affordability Adjustment Application
- For comparables sold during less favorable affordability periods, apply positive adjustments reflecting current improved conditions
- For comparables sold during more favorable conditions, make minimal or negative adjustments
- Document the affordability context for each comparable in the valuation report
Step 4: Market Segment Validation
- Verify that adjusted valuations align with current buyer capacity in the subject property's market segment
- Cross-reference with active listings and pending sales showing market acceptance of pricing
- Consider absorption rates for similar properties as validation
This approach ensures valuations reflect genuine market capacity rather than simply extrapolating historical prices forward without context.
Special Considerations for New Construction Valuations
The significant builder price reductions in late 2025—with 40% of builders cutting prices by approximately 5% [5]—create unique valuation challenges. When assessing new construction or recently completed properties:
✅ Recognize builder pricing as market signal: Price cuts indicate builders' assessment of genuine buyer capacity, not distressed selling
✅ Adjust older comparables upward cautiously: Pre-price-cut sales may not reflect current market equilibrium
✅ Factor incentive packages: Builder-paid closing costs, rate buydowns, and upgrades represent real value that affects comparable analysis
✅ Consider absorption rates: Properties sitting longer indicate pricing above current affordability levels
For help-to-buy valuations and similar government-assisted purchase schemes, understanding genuine affordability improvements helps ensure fair valuations that protect both buyers and lenders.
Implementing Affordability-Driven Valuation Adjustments in Professional Practice
Theory matters little without practical implementation. Surveyors must develop systematic approaches to incorporate affordability considerations into their daily valuation work while maintaining professional standards and defensibility.

Developing an Affordability-Adjusted Valuation Framework
Professional implementation requires structured processes that can be consistently applied and clearly documented:
Building Your Affordability Database
Create and maintain a regional affordability tracking system:
-
Monthly mortgage rate monitoring: Track average rates for typical first-time buyer products (95% LTV) and move-up buyer products (80% LTV)
-
Income requirement calculations: Calculate monthly the income needed to purchase properties at various price points in your service area
-
Lender criteria tracking: Maintain relationships with mortgage brokers to understand evolving lending standards, debt-to-income ratios, and qualification requirements
-
Builder activity monitoring: Track new construction pricing, incentives, and absorption rates as leading indicators of market affordability perception
-
Demographic data: Monitor local employment statistics, wage growth, and migration patterns that affect buyer capacity
This database becomes the foundation for defensible affordability adjustments in your valuation reports.
Reporting Affordability Adjustments Transparently
Professional credibility requires clear documentation of methodology. In your valuation reports, include:
Affordability Context Section: A brief paragraph explaining current affordability conditions relative to historical norms:
"The subject property falls within a price range where buyer affordability has improved significantly over the past 12 months. Required household income has decreased from approximately £95,000 to £88,000 due to mortgage rate stabilization and expanded lending criteria. This represents a 7.4% improvement in affordability that has expanded the qualified buyer pool."
Comparable Adjustment Explanation: When making affordability-based adjustments, document the rationale:
"Comparable #3 sold in March 2025 when mortgage rates averaged 6.8% and required income was £97,500. Current conditions with rates at 6.1% and required income of £88,000 represent improved affordability. A +3% adjustment has been applied to reflect the subject property's position in a more favorable market environment."
Market Conditions Addendum: Consider adding a standardized market conditions section addressing:
- Current mortgage rate environment
- Year-over-year affordability trend
- Local buyer demographic shifts
- Builder activity and pricing trends
Integrating Technology and Data Sources
Modern valuation practice increasingly relies on technology to process affordability data:
Mortgage Rate APIs: Integrate real-time rate data into your valuation software to automatically calculate income requirements for subject properties and comparables.
Affordability Calculators: Develop or adopt tools that quickly compute required income based on property price, current rates, typical down payments, and local property taxes/insurance.
Market Data Platforms: Utilize MLS data, public records, and proprietary databases to track absorption rates, price trends, and inventory levels by affordability segment.
Geographic Information Systems (GIS): Map affordability improvements by neighborhood or postcode to identify micro-markets with the strongest buyer capacity gains.
Chartered surveyors in London and surrounding areas including West London, North London, and South West London should leverage technology to track affordability variations across these distinct sub-markets.
Addressing Professional Standards and Regulatory Compliance
Affordability-driven adjustments must align with professional valuation standards:
RICS Red Book Compliance: Ensure affordability considerations fit within the RICS Valuation – Global Standards framework, particularly regarding market value definition and comparable selection criteria.
Documentation Standards: Maintain working files that clearly show:
- Data sources for affordability metrics
- Calculation methodology for adjustments
- Rationale for adjustment magnitude
- Validation through market evidence
Peer Review Readiness: Structure your affordability analysis so that another competent surveyor could review your work and understand your reasoning without extensive explanation.
Client Communication: Educate clients—whether lenders, buyers, or legal professionals—about why affordability considerations matter for accurate valuations in 2026's evolving market.
Case Study Applications
Consider these practical scenarios:
Scenario 1: First-Time Buyer Property in Improving Market
- Subject: 2-bedroom flat, £285,000 asking price
- Comparable sales from 6-12 months ago: £270,000-£280,000
- Affordability improvement: 6% reduction in required income
- Adjustment: +4% to comparables to reflect expanded buyer pool and improved purchasing capacity
- Resulting valuation: £285,000 supported despite being above recent comparable range
Scenario 2: New Construction with Builder Incentives
- Subject: 3-bedroom new build, builder asking £425,000 with £15,000 incentive package
- Comparable resale properties: £410,000-£420,000
- Builder price reduction context: 5% cuts common in area
- Adjustment: Net effective price £410,000, aligned with resale comparables after accounting for incentive value
- Resulting valuation: £410,000, recognizing builder pricing reflects current market affordability
Scenario 3: Investment Property in Mixed Affordability Environment
- Subject: 1-bedroom flat, buy-to-let market
- Owner-occupier affordability: Improved 5%
- Rental affordability: Stable (tenant incomes not keeping pace)
- Adjustment: Minimal affordability adjustment as investor buyers focus on yield, which hasn't materially changed
- Resulting valuation: Based primarily on traditional income approach with rental comparables
Training and Professional Development
Surveyors should pursue ongoing education in:
- Economic indicators: Understanding how employment, wages, and inflation affect buyer capacity
- Mortgage market dynamics: Staying current with lending product evolution and criteria changes
- Demographic analysis: Recognizing how population shifts affect local market affordability
- Data analytics: Developing skills to process and interpret affordability metrics systematically
Professional organizations and continuing education providers increasingly offer courses addressing these evolving valuation considerations.
Collaboration with Related Professionals
Effective affordability-driven valuation requires input from:
- Mortgage brokers: Providing real-world intelligence on lending criteria evolution and buyer qualification trends
- Estate agents: Offering market feedback on buyer response to pricing and affordability perceptions
- Economists: Supplying regional economic forecasts and employment trend analysis
- Other surveyors: Sharing best practices and validation of methodology through professional networks
Building these relationships enhances the quality and defensibility of affordability-adjusted valuations.
Conclusion
The 2026 property market presents a unique opportunity for surveyors to demonstrate professional value by incorporating genuine affordability improvements into valuation assessments. With income requirements down 4% nationally, regional variations showing improvements up to 7.4%, and fundamental shifts in lending criteria, traditional price-only comparable analysis risks missing critical market dynamics [1].
Affordability-driven valuation adjustments aren't about inflating values—they're about accurately reflecting expanded buyer capacity when purchasing power genuinely improves. Surveyors who develop systematic approaches to track affordability metrics, adjust comparables appropriately, and document their methodology transparently will provide more accurate valuations that serve clients, lenders, and the market better.
The typical household still faces a £25,000 income shortfall to afford the median-priced home [7], but the gap is narrowing for the first time in years. This creates distinct market segments with different affordability trajectories that require nuanced analysis rather than one-size-fits-all approaches.
Actionable Next Steps for Surveyors
🎯 Immediate Actions:
- Establish a monthly affordability tracking system for your primary service areas
- Review your last 10 valuations to identify where affordability considerations might have influenced more accurate assessments
- Develop standardized language for documenting affordability adjustments in reports
📊 30-Day Implementation:
- Build relationships with 2-3 mortgage brokers to gain ongoing intelligence about lending criteria evolution
- Create affordability adjustment templates that can be quickly customized for different property types
- Attend continuing education focused on economic indicators and market analysis
🔄 Ongoing Practice Development:
- Conduct quarterly reviews of your affordability database and adjustment methodology
- Participate in professional forums to share best practices with other surveyors
- Seek peer review of affordability-adjusted valuations to refine your approach
The surveyors who embrace affordability-driven valuation adjustments in 2026 will position themselves as forward-thinking professionals who understand that genuine market value reflects buyer capacity, not just historical prices. As first-time buyer purchasing power continues to improve through the year, this approach will increasingly differentiate accurate valuations from those anchored too heavily in outdated market conditions.
For professional valuation services in London and surrounding areas, understanding and implementing these affordability considerations ensures clients receive assessments that reflect current market realities and position them for successful transactions in an evolving property landscape.
References
[1] Homebuying Affordability Improving 2026 – https://www.redfin.com/news/homebuying-affordability-improving-2026/
[2] How Rising Costs Affect Home Affordability 3 – https://eyeonhousing.org/2026/02/how-rising-costs-affect-home-affordability-3/
[3] Could More First Time Buyers Make The Math Work In 2026 – https://www.nar.realtor/magazine/real-estate-news/could-more-first-time-buyers-make-the-math-work-in-2026
[4] Housing Prices Outpace Household Income Delaying First Time Buyers – https://hardwareretailing.com/housing-prices-outpace-household-income-delaying-first-time-buyers/
[5] Housing Affordability Crisis New Home Price Cuts Realtor Com Report – https://fortune.com/2026/02/12/housing-affordability-crisis-new-home-price-cuts-realtor-com-report/
[7] Affordability Improves Typical Households Still Experience 25k Shortfall – https://nationalmortgageprofessional.com/news/affordability-improves-typical-households-still-experience-25k-shortfall