Surveyors who still deliver static PDF reports three days after a site visit are losing clients to competitors who push live data to a dashboard within minutes. That gap is no longer a technology problem — it is a workflow problem. The tools to build end-to-end, real-time data processing pipelines now exist at accessible price points, and the surveyors who master them in 2026 will define the next decade of the profession.
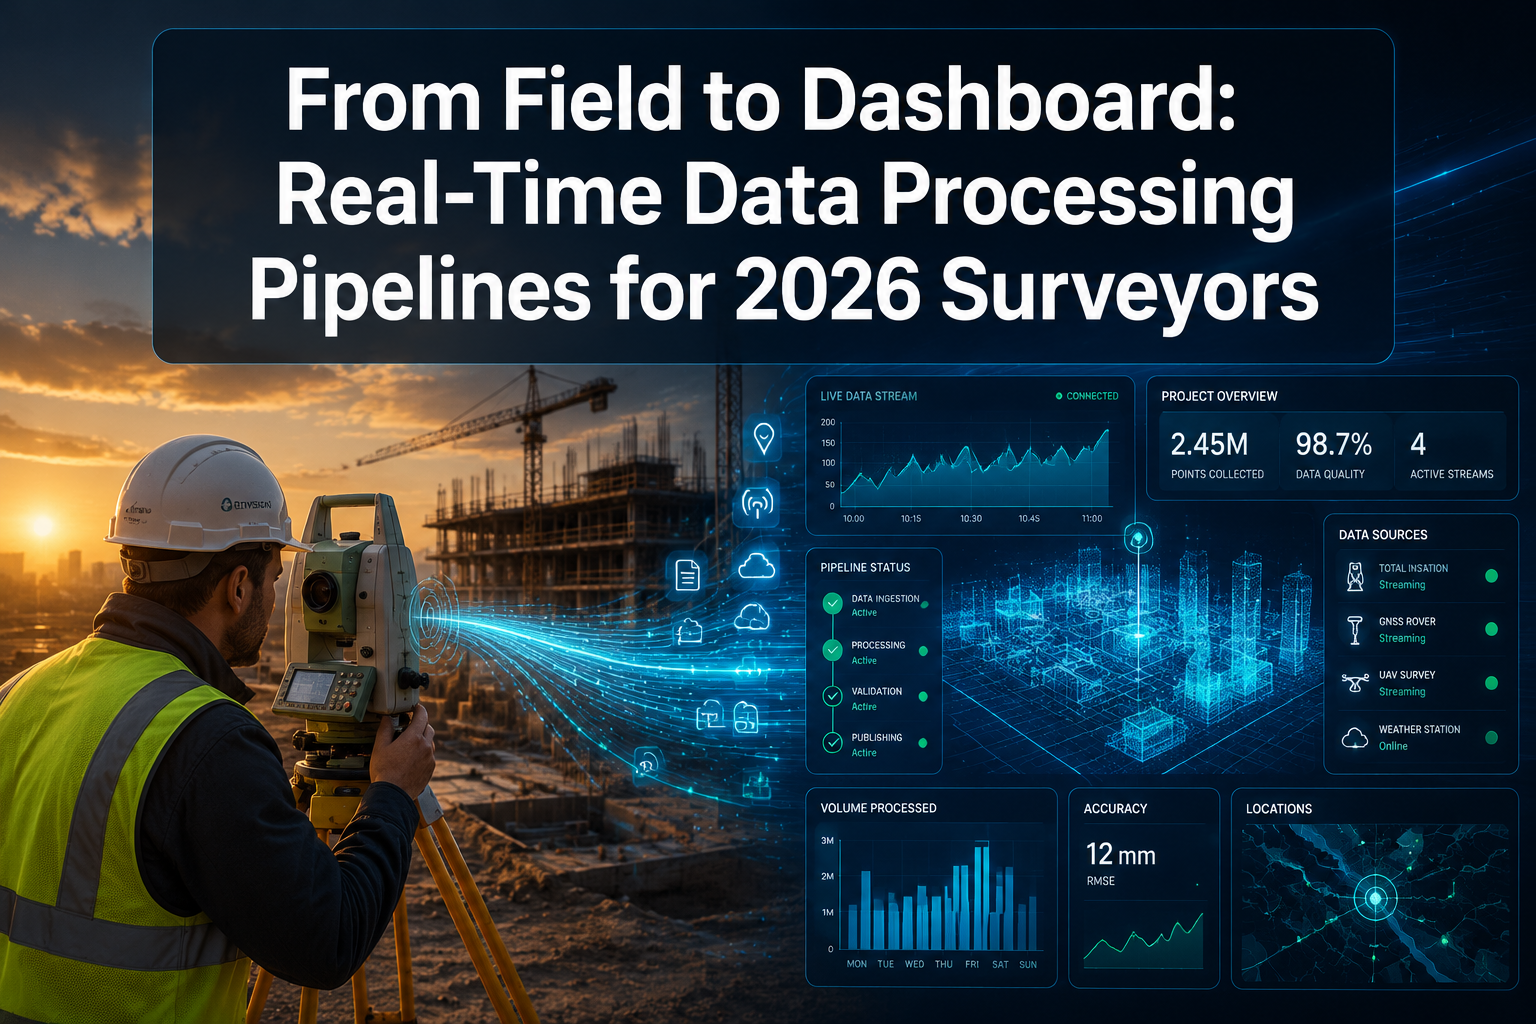
This article maps the complete journey described in From Field to Dashboard: Real-Time Data Processing Pipelines for 2026 Surveyors — from the moment a sensor captures a measurement on site, through cloud ingestion and AI enrichment, to a live client-facing dashboard that updates in near real time.
Key Takeaways
- Real-time data pipelines can reduce survey-to-report delivery time from days to minutes, giving clients live visibility into findings.
- RTK GNSS corrections, drone photogrammetry, and handheld LiDAR now feed directly into cloud streaming platforms with sub-centimetre accuracy.
- AI enrichment layers — classification, anomaly detection, and validation — run automatically inside the pipeline before data reaches the dashboard.
- Platforms such as Timeplus, Layline.io, and Rayven process events with latencies measured in milliseconds, making real-time delivery genuinely practical at scale [1][2][7].
- Chartered surveyors who integrate live pipelines into their practice can differentiate on speed, transparency, and data quality — not just professional credentials.
Why Static Reports No Longer Serve Modern Clients
A traditional building survey workflow looks like this: visit the site, take notes and photographs, return to the office, write a report, and send a PDF. The client waits. If a critical defect is found on day one of a multi-day inspection, the client does not know until the report lands in their inbox.
This model carries real risk. Decisions about purchase, insurance, or construction are delayed. Errors found late are expensive to correct. Clients who need to act quickly — particularly in competitive property markets — are left without the information they need.
The shift toward real-time data processing pipelines changes this dynamic entirely. Data captured in the field is streamed, validated, enriched, and visualised on a shared dashboard before the surveyor has left the site. For chartered surveyors in London operating across complex urban projects, this is not a luxury — it is becoming a baseline expectation.
The core problem with batch processing:
| Batch Workflow | Real-Time Pipeline |
|---|---|
| Data collected, then processed later | Data processed as it arrives |
| Report delivered in 1-3 days | Dashboard updated in seconds |
| Errors found after the fact | Validation flags raised instantly |
| Client has no visibility during survey | Client monitors progress live |
| Single static output | Continuous, queryable data stream |
The Architecture Behind From Field to Dashboard: Real-Time Data Processing Pipelines for 2026 Surveyors
Understanding the pipeline requires breaking it into its five core layers. Each layer has a specific job, and failure at any layer breaks the real-time promise.
Layer 1 — Field Data Capture
The pipeline begins with sensors. In 2026, surveyors have access to a richer capture toolkit than ever before:
- RTK GNSS receivers delivering 1-2 cm horizontal accuracy without a base station, using NTRIP correction streams from networks of over 20,000 reference stations across 145+ countries [5].
- Drone-mounted cameras and LiDAR generating dense 3D point clouds over large sites in a single flight. For property professionals, drone roof surveys in London now produce georeferenced outputs that feed directly into downstream processing.
- Handheld photogrammetry devices that capture survey-grade 3D datasets without requiring specialist equipment or complex setup, making them practical for indoor structural assessments.
- IoT sensors embedded in structures, monitoring crack propagation, moisture levels, and load distribution continuously.
The key requirement at this layer is that data must be tagged with a timestamp, a geolocation reference, and a sensor identifier the moment it is captured. Without this metadata, downstream processing cannot place the reading in context.
Layer 2 — Edge Processing and Transmission
Raw sensor data is rarely ready for a dashboard. At the edge — meaning on the device or a local gateway before data leaves the site — basic filtering, compression, and formatting occur. This reduces bandwidth requirements and ensures that the cloud ingestion layer receives clean, structured events rather than raw binary streams.
Platforms like Rayven process every data event upon arrival, executing immediate workflows without batch delays, handling inputs from IoT sensors, API calls, and file uploads simultaneously [7]. This edge-to-cloud handoff is where latency is either controlled or lost.
Layer 3 — Cloud Ingestion and Stream Processing
Once data reaches the cloud, a streaming SQL engine takes over. Timeplus Enterprise v2.7, for example, offers a single-binary, vectorised streaming SQL platform deployable across edge, cloud, and hybrid environments [1]. This means a surveying firm can run the same query logic on a site laptop as on a cloud cluster, with results consistent across both.
Layline.io demonstrates what scale looks like at the enterprise level: processing over 100 billion events per day with 99.999% uptime and sub-millisecond latency, using a visual workflow designer that requires no coding [2]. For surveying firms without dedicated engineering teams, no-code pipeline builders are a practical entry point.
Speed benchmarks that matter for surveyors:
- Sub-millisecond latency: achievable with platforms like Layline.io for high-frequency sensor data [2]
- Under 5 milliseconds end-to-end: demonstrated by platforms processing billions of events per second [4]
- Near-real-time dashboard refresh: typically 1-10 seconds for geospatial visualisation layers
Layer 4 — AI Enrichment and Validation
Raw survey data arriving in a cloud pipeline is not yet intelligence. The AI enrichment layer transforms it. Common enrichment tasks in a surveying context include:
- Automatic classification of point cloud returns (ground, vegetation, structure, water) using machine learning models trained on survey datasets. HydroStack applies this approach to multibeam echosounder data, using AI to classify MBES points and detect review targets automatically [6].
- Anomaly detection that flags readings outside expected tolerance ranges — for example, a crack width measurement that exceeds a structural threshold triggers an alert before the surveyor has moved to the next room.
- Data validation against reference schemas, ensuring that every record entering the dashboard meets quality standards. Snowplow's pipeline architecture demonstrates this with collection, validation, enrichment, and transformation running as sequential pipeline stages, delivering AI-ready data to downstream destinations [3].
- Semantic enrichment that links a sensor reading to its parent asset — a specific wall, floor slab, or roof section — enabling dashboard users to click on a building element and see its full measurement history.
Layer 5 — Dashboard Delivery and Client Access
The final layer is what the client sees. A well-designed survey dashboard in 2026 is not a static map — it is a live, queryable interface that shows:
- Current survey progress (percentage of site covered)
- Flagged defects with severity ratings, photographs, and geolocation
- Measurement trends over time for monitored assets
- Exportable data in multiple formats for use by architects, engineers, and legal teams
Data Halo's pipeline survey platform illustrates this well, providing daily tracking and mapping to keep project data current with transparent reporting that identifies data issues in real time [10]. For clients commissioning structural surveys in London, this level of transparency fundamentally changes the client relationship.
Practical Applications: Where Real-Time Pipelines Change Outcomes
The abstract architecture becomes meaningful when mapped to real surveying scenarios.
Building Condition Surveys
A surveyor conducting a specific defect report on a large commercial property can stream photographic evidence, moisture readings, and crack measurements directly to a shared dashboard. The client's project manager, sitting in a different city, watches defects populate in real time. Priority issues are escalated immediately rather than buried in a report section.
Boundary and Land Surveys
RTK GNSS data streamed through a pipeline with sub-centimetre accuracy means that boundary surveys in London produce georeferenced outputs that are queryable the moment the field work ends. Disputes that previously required weeks of back-and-forth over static plans can be resolved with reference to a shared, timestamped dataset.
Dilapidations and Schedule of Condition
For dilapidation surveys in London, a real-time pipeline means that a schedule of condition is built incrementally as the surveyor moves through a property. Each room's condition is logged, photographed, and appended to the live document. By the time the surveyor completes the inspection, the draft schedule is already 80% complete.
Roof Inspections with Drone Integration
Drone-captured imagery processed through an AI classification pipeline can identify surface deterioration, blocked outlets, and structural deformation within minutes of the flight completing. This is particularly relevant for large commercial roofs where manual inspection is slow and hazardous.
Selecting the Right Pipeline Stack for a Surveying Practice
Not every surveying firm needs to build a bespoke pipeline from scratch. The market in 2026 offers a spectrum of options:
For small practices (1-10 surveyors):
- No-code pipeline builders with visual workflow designers
- Cloud-hosted dashboards with pre-built survey templates
- Subscription-based RTK correction services
- Estimated setup time: 2-4 weeks
For mid-size firms (10-50 surveyors):
- Managed pipeline services with guaranteed uptime SLAs — TeraDB Cloud, for example, offers managed real-time data pipelines with zero downtime and continuous integration from IoT devices and diverse data sources [8]
- Integration with existing practice management software via API connectors — platforms like Zipline offer over 60 connectors including Snowflake, BigQuery, and S3 [9]
- Custom dashboard development on top of standard data layers
- Estimated setup time: 6-12 weeks
For large firms and national practices:
- Full streaming SQL infrastructure with edge deployment capability
- AI model training on proprietary survey datasets
- Multi-tenant dashboards for different client accounts
- Integration with BIM (Building Information Modelling) platforms
- Estimated setup time: 3-6 months
Key selection criteria:
| Criterion | Why It Matters |
|---|---|
| Latency specification | Determines how "live" the dashboard actually is |
| Connector library | Affects which field devices can feed the pipeline |
| No-code vs. code-first | Determines whether a surveyor or an engineer builds it |
| Data residency options | Critical for UK GDPR compliance |
| Uptime SLA | Determines reliability during active site operations |
From Field to Dashboard: Real-Time Data Processing Pipelines for 2026 Surveyors — Overcoming the Barriers
The three most common objections to adopting real-time pipelines in surveying practice are cost, complexity, and connectivity. Each has a practical answer.
Cost: The managed pipeline market has driven prices down significantly. Entry-level streaming platforms now operate on consumption-based pricing, meaning a small firm pays only for the data it processes. The return on investment comes from reduced report-writing time, faster client turnaround, and the ability to charge a premium for live-data deliverables.
Complexity: Visual workflow designers and no-code pipeline builders have removed the requirement for software engineering skills. A surveyor who can configure a spreadsheet formula can configure a basic pipeline transformation rule. For chartered surveyors in West London and beyond, vendor-supported onboarding programmes reduce the learning curve further.
Connectivity: Edge processing handles the connectivity problem. Data is buffered locally when a site has poor signal, then synced to the cloud when connectivity is restored. Platforms designed for IoT environments — common in remote infrastructure surveys — handle this gracefully without data loss [9].
"The pipeline does not replace the surveyor's professional judgement — it removes the administrative burden that delays that judgement reaching the client."
Quality, Compliance, and Professional Standards
Real-time pipelines introduce new questions about data integrity and professional liability. A dashboard that updates continuously must also maintain an auditable record of every data point — when it was captured, by whom, with what instrument, and whether it passed validation.
RICS guidance on digital data management emphasises that the professional surveyor remains responsible for the accuracy and interpretation of outputs, regardless of the technology used to deliver them. This means that AI classification results must be reviewable, pipeline validation rules must be documented, and dashboard outputs must be exportable in formats that can be submitted as evidence in legal or regulatory proceedings.
For practices handling sensitive work — such as party wall matters or commercial valuations — the audit trail built into a well-designed pipeline is actually a compliance advantage, not a liability.
The Client Experience Transformation
The shift from a static report to a live dashboard is not just an operational change — it is a client experience transformation. Clients who can watch a survey unfold in real time report higher confidence in the process, fewer follow-up queries, and greater willingness to act on findings quickly.
This matters commercially. A surveying practice that offers live dashboards as standard can position itself differently in a competitive market. For clients commissioning homebuyer reports or building surveys, the ability to see findings as they emerge — rather than waiting for a document — changes the perceived value of the service.
The pipeline is, ultimately, a client retention and acquisition tool as much as it is a technical infrastructure investment.
Conclusion
The journey described in From Field to Dashboard: Real-Time Data Processing Pipelines for 2026 Surveyors is no longer theoretical. Every component — RTK capture, edge processing, cloud streaming, AI enrichment, and live dashboards — is commercially available, increasingly affordable, and proven at scale.
Actionable next steps for surveying practices in 2026:
- Audit your current data workflow. Map every step from field capture to client delivery and identify where delays occur and where data is manually re-entered.
- Pilot a no-code pipeline tool. Select one survey type — a roof inspection or a schedule of condition — and build a simple pipeline that streams data to a shared dashboard. Measure the time saved.
- Invest in RTK-capable field equipment. Ensure that field devices output structured, timestamped data that a pipeline can ingest without manual formatting.
- Define your dashboard template. Work with a sample client to design a dashboard layout that meets their reporting needs before building the pipeline around it.
- Document your data governance policy. Establish clear rules for data validation, retention, and audit trails before going live with client-facing dashboards.
- Engage with your professional body. RICS guidance on digital data delivery is evolving — staying current ensures that pipeline outputs meet professional indemnity requirements.
The surveyors who act on these steps now will not just be faster than their competitors. They will be delivering a fundamentally different — and better — service.
References
[1] timeplus – https://www.timeplus.com/?utm_source=openai
[2] layline – https://layline.io/?utm_source=openai
[3] Data Pipeline – https://snowplow.io/data-pipeline?utm_source=openai
[4] rapideta.us – https://rapideta.us/?utm_source=openai
[5] Surveying – https://rtkdata.com/surveying/?utm_source=openai
[6] hydrostack.nl – https://hydrostack.nl/?utm_source=openai
[7] Real Time Data Processing – https://www.rayven.io/platform/data/real-time-data-processing?utm_source=openai
[8] Real Time Data Pipelines – https://www.teradbcloud.com/services/real-time-data-pipelines/?utm_source=openai
[9] zipline.run – https://zipline.run/?utm_source=openai
[10] data-halo – https://data-halo.com/?utm_source=openai