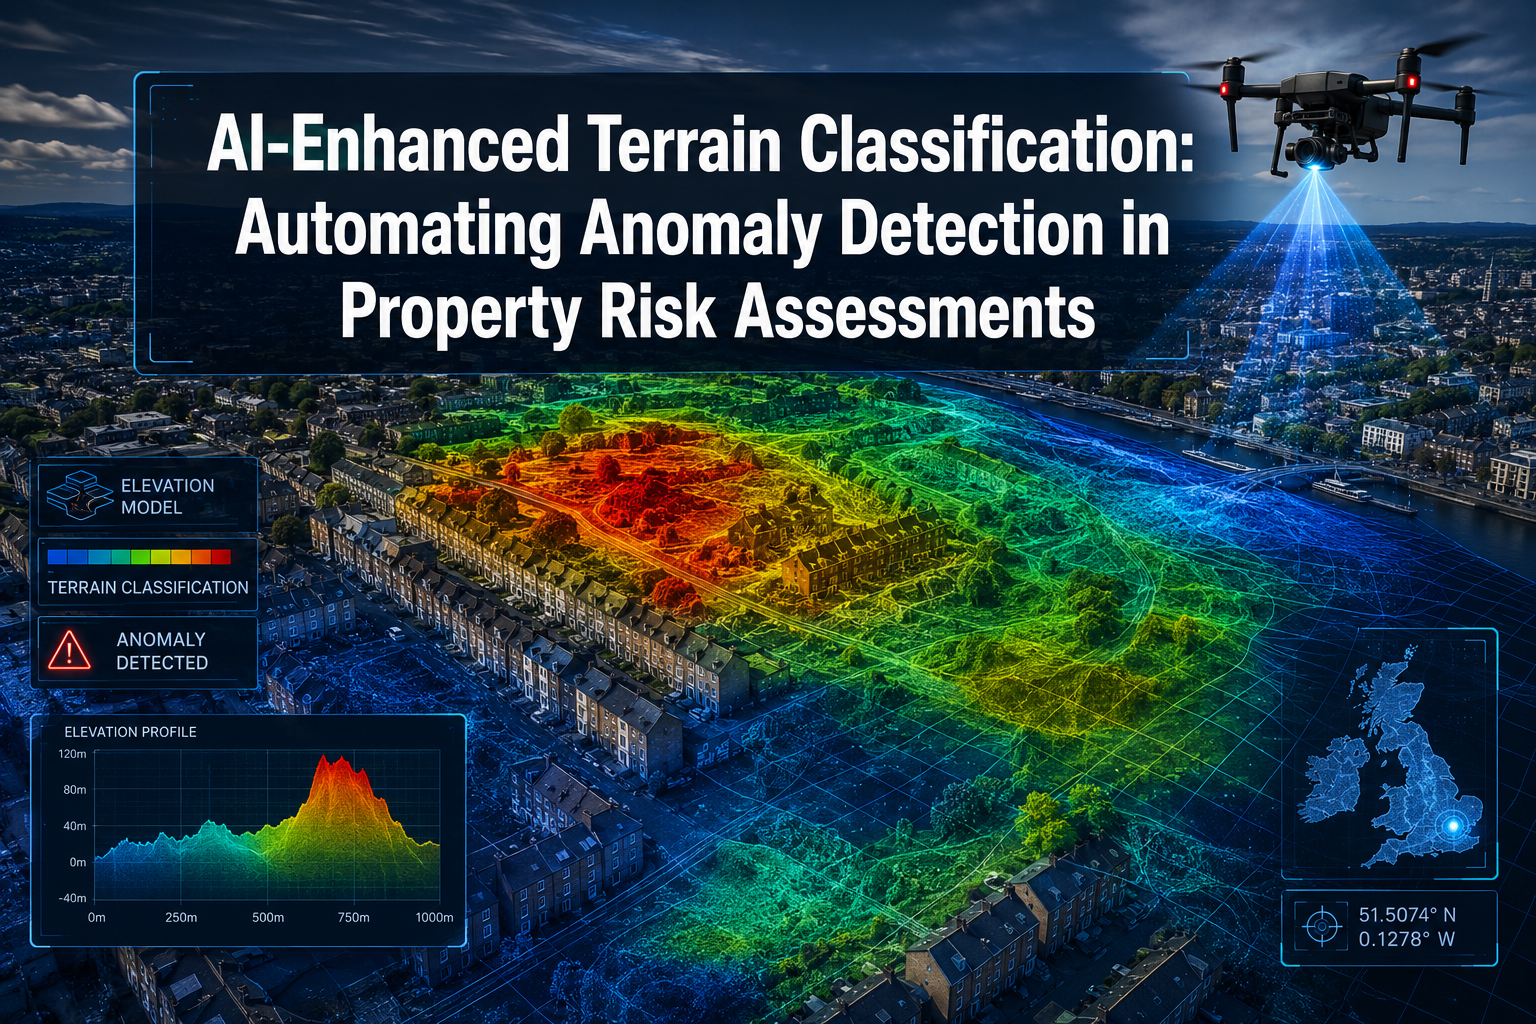
Subsidence-related insurance claims in the United Kingdom cost the industry an estimated £400 million in a single dry year, yet traditional ground surveys still miss early-stage soil movement that satellite and drone sensors can detect weeks in advance. That gap between what conventional methods catch and what machine learning can flag is precisely where AI-Enhanced Terrain Classification: Automating Anomaly Detection in Property Risk Assessments is transforming the profession in 2026.
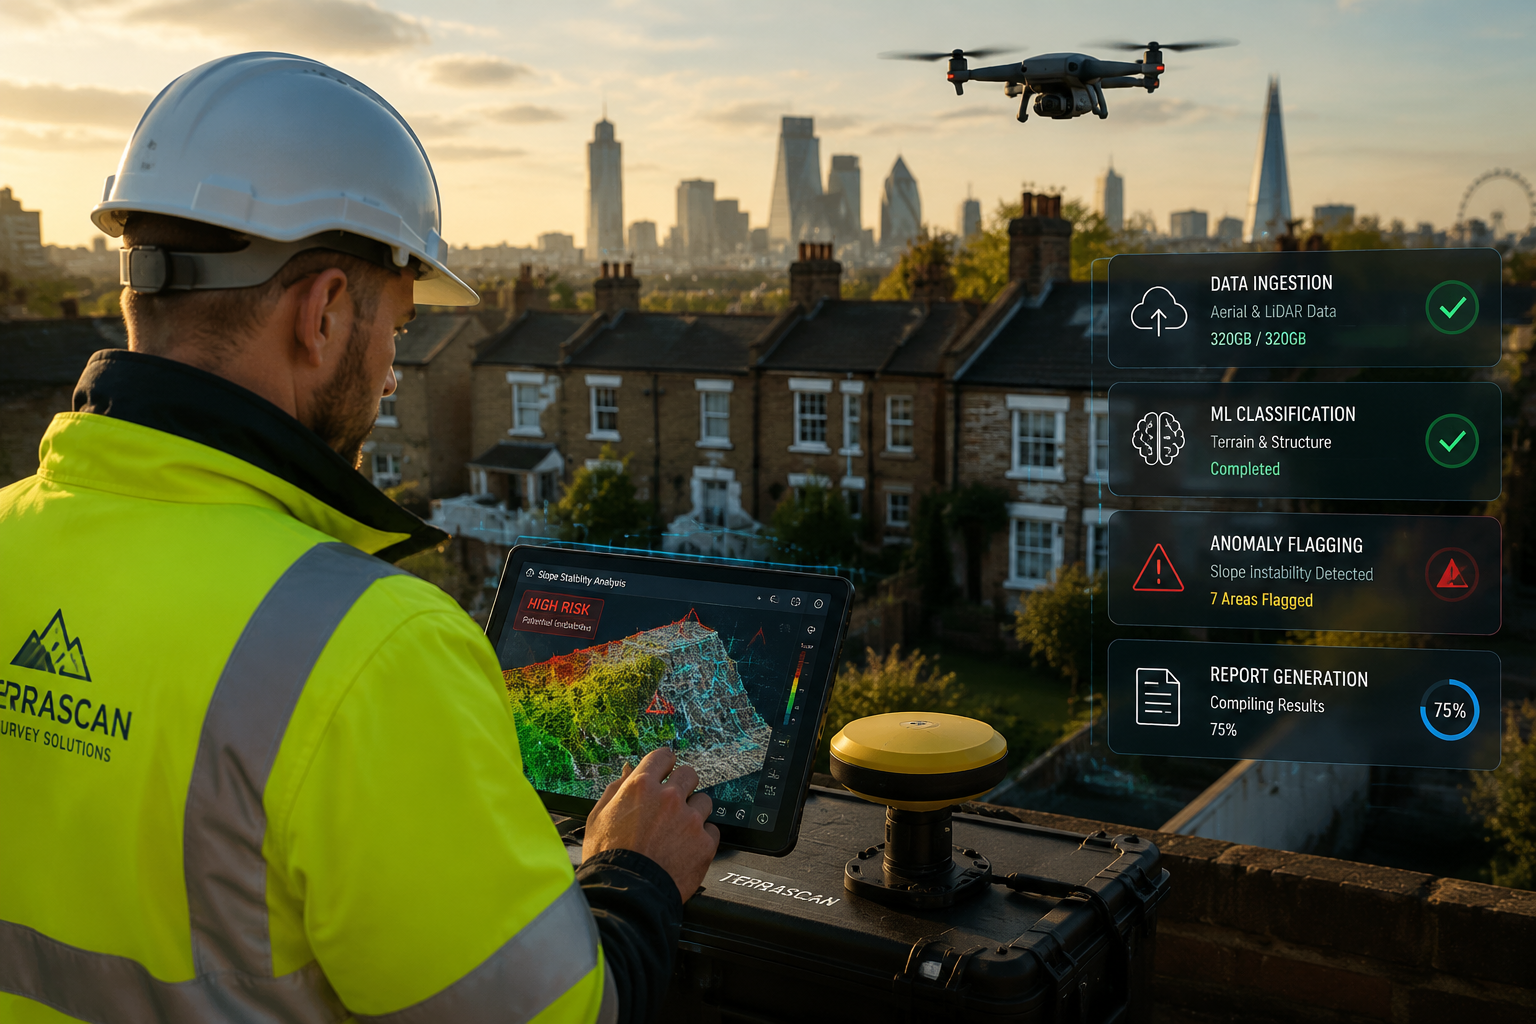
By feeding LiDAR point clouds, multispectral drone imagery, and historical claims data into purpose-built classification algorithms, property risk teams are compressing multi-day desktop studies into analyses that take minutes, with some platforms reporting speed improvements of up to 70% compared to manual workflows.
Key Takeaways
- Machine learning algorithms can classify soil types and flag subsidence, slope instability, and vegetation risks directly from drone and LiDAR data, cutting analysis time by up to 70%.
- Commercial platforms now combine satellite imagery, aerial photography, and claims history to deliver anomaly detection at parcel level without requiring a site visit.
- Accuracy rates of 94% have been reported for risk prediction tasks such as wildfire exposure and mineral anomaly detection, rivalling expert manual review.
- Structured AI workflows benefit from human validation checkpoints, especially for complex sites where ground-truthing remains essential.
- Chartered surveyors who integrate AI terrain tools alongside traditional structural surveys produce more defensible, data-rich reports for clients and insurers.
How Machine Learning Classifies Terrain for Property Risk
The foundation of AI-Enhanced Terrain Classification: Automating Anomaly Detection in Property Risk Assessments lies in how algorithms learn to distinguish one ground condition from another. Three data types drive most commercial systems today.
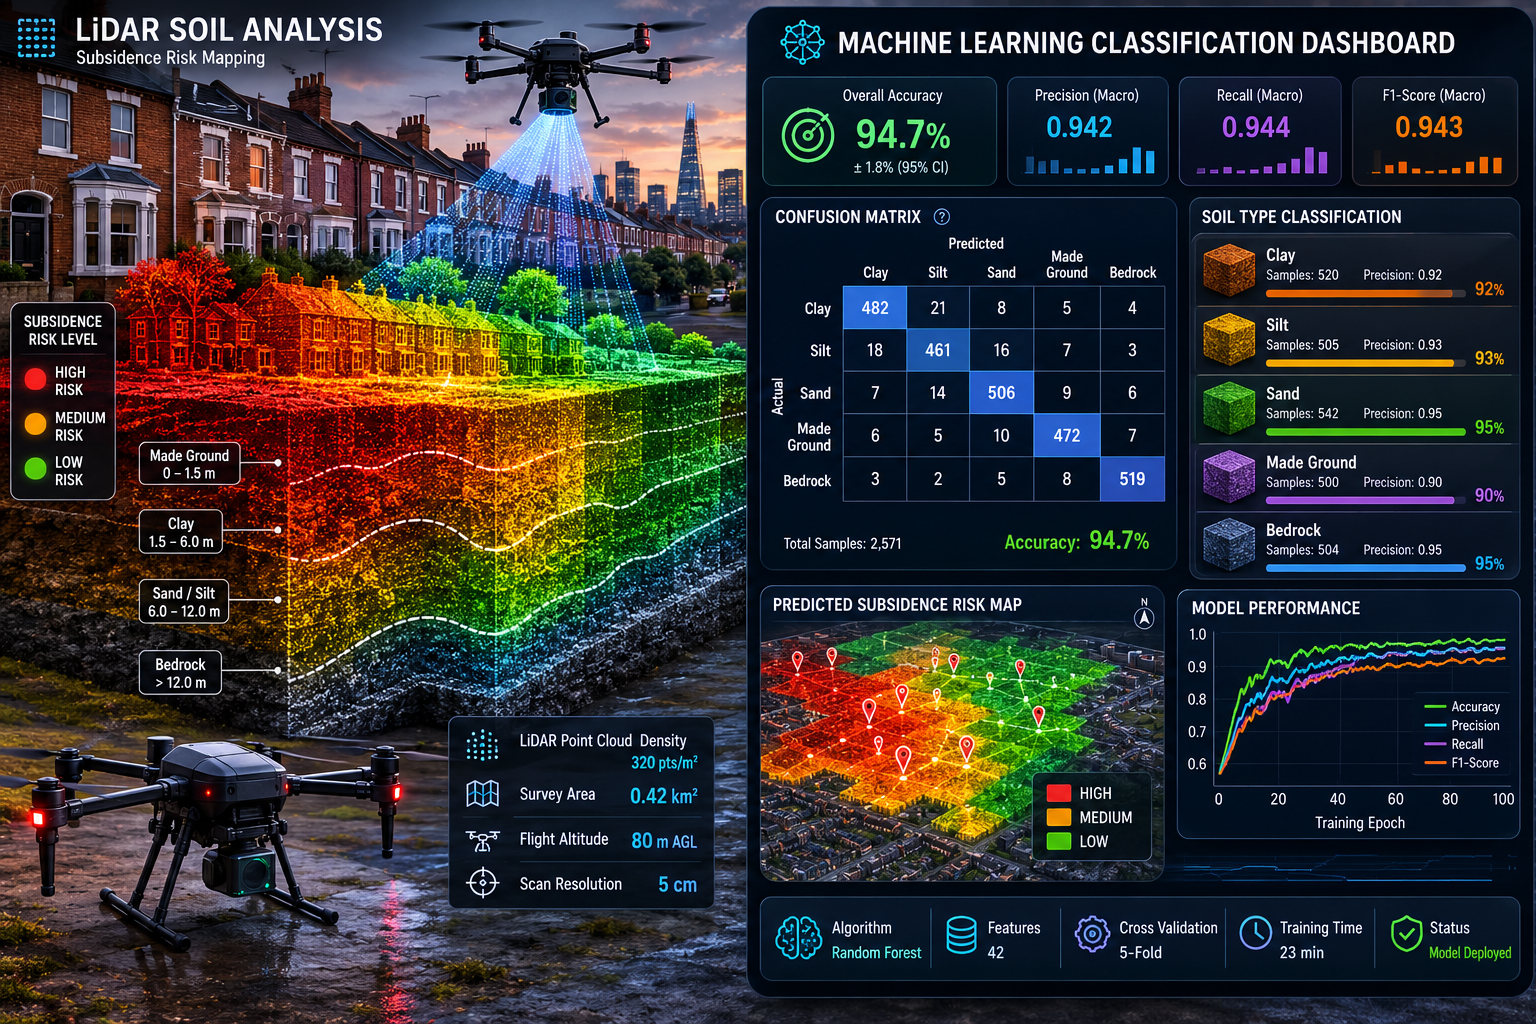
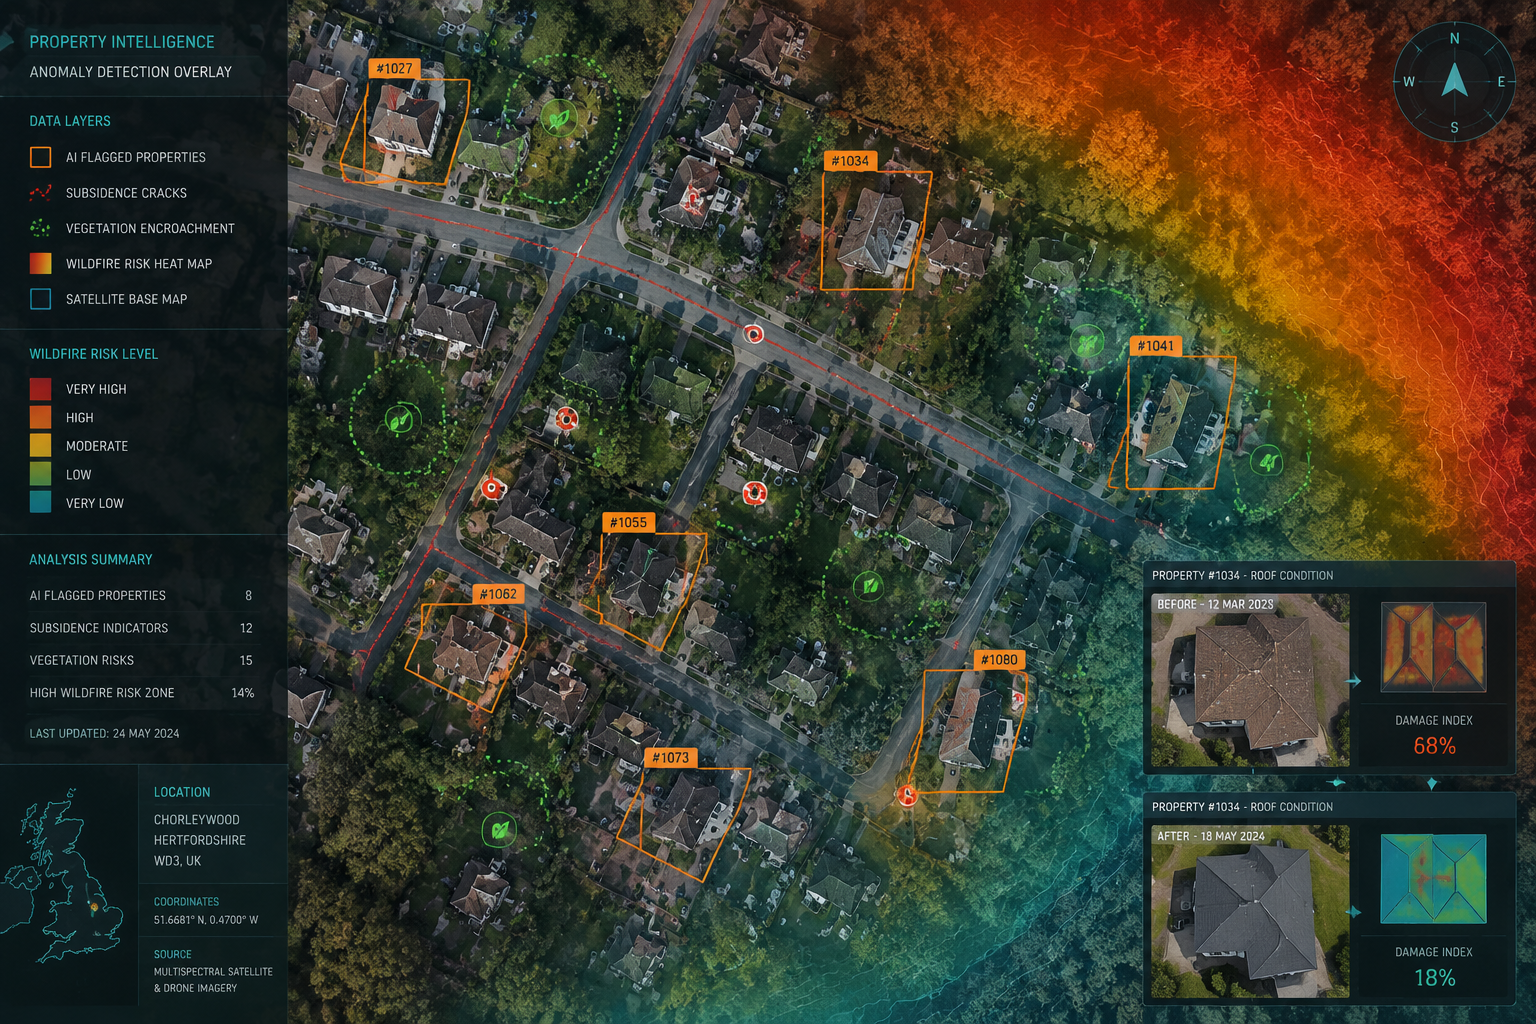
LiDAR (Light Detection and Ranging) produces dense three-dimensional point clouds that reveal micro-topographic features invisible to standard photography. When a building sits on clay-rich soil that has begun to shrink, LiDAR captures millimetre-scale surface depressions long before cracking becomes visible. Platforms such as SlopeWise transform existing drone survey data into intelligent slope monitoring systems, detecting cracks and assessing risk without altering current workflows, which makes adoption straightforward for teams already running drone programmes [10].
Multispectral and hyperspectral satellite imagery adds a second classification layer. Soil moisture content, organic matter, and certain mineral compositions each reflect electromagnetic radiation at characteristic wavelengths. GeoVoid AI's platform uses satellite imagery from NASA and ESA Sentinel/Copernicus sources to assess groundwater potential and underground void risks before any field investigation takes place [2]. GeoEvo similarly applies Sentinel-2 data to screen sites for flood risk, land use history, and environmental compliance, delivering professional-grade analysis in minutes [uncited].
Aerial photography with computer vision closes the loop at parcel level. Nearmap has developed over 130 AI-derived property insights trained on proprietary aerial data, detecting surfaces, vegetation encroachment, and roof conditions so that underwriters and assessors can make informed decisions without a site visit [8]. Parcel-Sense adds another layer by using computer vision and spatial logic to detect structures directly from aerial imagery, identifying buildings that may be missing or misattributed in parcel records [9].
Core ML Algorithms Used in Terrain Classification
| Algorithm Type | Primary Use Case | Typical Output |
|---|---|---|
| Convolutional Neural Networks (CNN) | Image-based defect and feature detection | Classified pixel maps, bounding boxes |
| Random Forest / Gradient Boosting | Multi-variable risk scoring | Probability scores per parcel |
| Anomaly Detection (Autoencoder) | Flagging unusual ground conditions | Anomaly heat maps |
| Depth Estimation Models | 3D reconstruction from 2D imagery | Surface elevation models |
| Semantic Segmentation | Soil type and land cover classification | Colour-coded terrain maps |
A recent research system called ARTPS (Autonomous Rover Target Prioritization System) demonstrated a hybrid approach combining depth estimation, anomaly detection, and learnable curiosity scoring, achieving an AUROC of 0.94 and an F1-Score of 0.87 on terrain datasets. While developed for planetary exploration, the architecture directly informs terrestrial property risk tools [uncited].
Key Platforms Driving Automated Anomaly Detection in Property Risk
The commercial landscape for AI-Enhanced Terrain Classification: Automating Anomaly Detection in Property Risk Assessments has matured rapidly. Below is a structured review of the leading tools relevant to property professionals in 2026.
Beagle Labs – Integrated Property Intelligence
Beagle Labs integrates enriched property data, hazard scores, claims history, and aerial roof condition analysis into a single underwriting platform. The system delivers an average inspection turnaround of 15 days or fewer, supported by a network of over 10,000 inspectors across 48 US states [1]. For UK practitioners, the architecture offers a blueprint: combining claims history with AI-derived physical condition scores to produce risk ratings that are both faster and more consistent than manual review.
TerraSatch – Terrain Hazard Modelling
TerraSatch combines drone flights, LiDAR, weather forecasts, and snowpack science into a modular terrain intelligence system. Its avalanche terrain and wildfire risk modules are particularly relevant for rural and semi-rural property portfolios [3]. The modular design means practitioners can activate only the hazard layers relevant to a given geography, keeping costs proportional to need.
Satelife – Wildfire Risk at Parcel Level
Satelife analyses satellite imagery, historical fire data, wind patterns, and terrain topology to produce wildfire risk assessments with a reported 94% accuracy rate. The platform has assessed over 50,000 properties and delivers biannual expert reports with prioritised mitigation plans [5]. The methodology is directly transferable to UK heathland and woodland-adjacent properties where wildfire risk is a growing concern.
Aeriscan – Sub-Centimetre Roof and Pavement Inspection
Aeriscan's AI-driven drone inspection system analyses every pixel of a roof or pavement surface, providing high-resolution defect detection at less than 1 cm resolution, 3D surface reconstruction, and severity mapping [7]. For commercial building surveys in London, this level of detail supports dilapidations assessments and reinstatement valuations with an audit trail that manual inspections cannot match.
LiveEO Treeline – Vegetation Risk Detection
LiveEO's Treeline product uses high-resolution satellite imagery and AI to detect and classify vegetation risks, including grow-in, fall-in, and hazard trees, across utility grids and property boundaries [6]. For properties with significant tree coverage, this continuous monitoring capability flags encroachment risks before they become structural problems, which is directly relevant to party wall damage assessments.
Rare Earth AI – Mineral Anomaly Detection
Rare Earth AI applies over 50 satellite sources and 1.2 billion data points to identify mineral anomalies with a 94% accuracy rate [4]. For property risk professionals assessing sites near former mining areas – a significant consideration across parts of Wales, Yorkshire, and the Midlands – this type of subsurface intelligence can prevent costly surprises during development.
"The shift from periodic manual inspection to continuous AI-monitored terrain assessment is not incremental. It changes the fundamental risk model from reactive to predictive."
Building an AI Terrain Classification Workflow: A Practical Template
Adopting AI-Enhanced Terrain Classification: Automating Anomaly Detection in Property Risk Assessments does not require replacing existing survey practices. The most effective implementations layer AI outputs on top of professional judgement rather than substituting for it. The workflow below reflects best practice for 2026.
Stage 1: Data Ingestion and Pre-Processing
Begin by defining the data sources available for the subject property or portfolio:
- Satellite imagery (Sentinel-2, commercial providers) for land cover and moisture indices
- LiDAR data (Environment Agency open data for England, or proprietary drone capture)
- Aerial photography (Nearmap, Getmapping, or similar providers)
- Historical claims and planning records for contextual risk scoring
Data must be co-registered to a common coordinate reference system before classification begins. Most commercial platforms handle this automatically, but bespoke workflows require a GIS pre-processing step.
Stage 2: Terrain Classification
Run the pre-processed data through the appropriate classification model:
- Apply a semantic segmentation model to identify land cover types: impervious surfaces, bare soil, vegetation, water bodies.
- Apply a soil moisture or clay content index derived from multispectral bands to flag shrink-swell susceptibility.
- Generate a digital terrain model (DTM) from LiDAR to identify slope angles, drainage patterns, and micro-depressions.
- Cross-reference with geological maps to assign soil type classifications (e.g., London Clay, Gault Clay, Made Ground).
For subsidence surveys in London, this stage is where the algorithm earns its value: it can screen dozens of parcels in the time a surveyor would manually review one.
Stage 3: Anomaly Detection and Flagging
The anomaly detection layer compares each parcel's terrain signature against a trained baseline. Deviations beyond a set threshold trigger flags in one or more risk categories:
- Subsidence risk: Surface depression, clay soil, moisture deficit, proximity to trees
- Slope instability: Gradient above threshold, evidence of historical movement, poor drainage
- Vegetation encroachment: Tree canopy overhang, root zone proximity to foundations
- Flood susceptibility: Low-lying position, impermeable surface coverage, proximity to watercourses
- Mining legacy: Proximity to historical mine workings, surface void indicators
Each flagged anomaly is assigned a confidence score and a severity rating. Only parcels above a defined severity threshold proceed to human review, which concentrates expert time where it adds the most value.
Stage 4: Human Validation and Report Integration
AI outputs are most defensible when a qualified professional validates the findings. For a structural survey in London, the AI terrain classification provides the pre-survey risk briefing, ensuring the surveyor knows exactly which areas to examine in detail before arriving on site.
Validation checkpoints include:
- Reviewing flagged anomalies against historical aerial photography to confirm trends
- Cross-referencing with planning applications and building control records
- Conducting targeted ground investigation where AI confidence scores fall below 80%
- Documenting the AI tool version, data sources, and classification parameters used
This documentation is increasingly expected by insurers and lenders as part of formal valuation reports and risk assessments.
Stage 5: Continuous Monitoring
A single classification is a snapshot. The competitive advantage of AI terrain tools lies in continuous monitoring, where the system re-runs classification on updated imagery at defined intervals and alerts the risk team when a parcel's status changes. SlopeWise exemplifies this approach, providing early warnings of slope instability through ongoing drone survey analysis [10].
For portfolio managers and commercial property owners, this ongoing intelligence supports proactive maintenance decisions and strengthens the case for favourable insurance terms.
Accuracy, Limitations, and Professional Standards
The performance figures cited by leading platforms are impressive, but practitioners must understand where AI terrain classification can and cannot be trusted.
Strengths:
- Consistent, repeatable classification unaffected by surveyor fatigue or subjectivity
- Ability to process large portfolios simultaneously
- Detection of anomalies at spatial scales too fine for visual inspection
- Continuous monitoring capability that periodic surveys cannot replicate
Limitations:
- Training data bias: models trained on US or Australian geologies may underperform on UK-specific soil conditions such as London Clay or Chalk
- Temporal resolution: satellite imagery revisit cycles (typically 5-10 days for Sentinel-2) mean very recent changes may not be captured
- Occlusion: dense tree canopy or urban canyon effects can obscure ground surface signals
- Regulatory standing: AI-derived outputs are not yet universally accepted as standalone evidence in legal or planning contexts
For properties where anomaly detection flags a high-risk result, a residential structural engineer's report remains the appropriate next step. AI classification accelerates triage; it does not replace professional certification.
RICS guidance in 2026 continues to emphasise that automated tools must be disclosed in reports and that the responsible professional retains accountability for the conclusions drawn. Practitioners using AI terrain tools should ensure their professional indemnity cover explicitly includes AI-assisted assessments.
The Commercial Case for AI Terrain Classification
The business argument for adopting automated anomaly detection is straightforward. Consider a portfolio of 500 residential properties requiring periodic risk review. A manual desktop study averaging four hours per property represents 2,000 hours of professional time. An AI-enhanced workflow that automates 70% of that analysis reduces the burden to approximately 600 hours, freeing capacity for higher-value advisory work.
For commercial property valuations, the stakes are higher still. A missed subsidence risk on a commercial asset can translate into a valuation error of hundreds of thousands of pounds and significant professional liability exposure. AI terrain classification, properly documented and validated, provides an additional layer of due diligence that strengthens the defensibility of professional opinions.
Insurers are beginning to price this capability into their products. Properties with verified AI monitoring programmes are increasingly eligible for enhanced terms, particularly in high-risk geographies such as clay-rich areas of South East England or flood-prone river corridors.
Conclusion
AI-Enhanced Terrain Classification: Automating Anomaly Detection in Property Risk Assessments is no longer an experimental technology. In 2026, it is a practical, commercially available capability that property professionals can integrate into existing workflows without abandoning the professional standards that underpin their practice.
Actionable next steps for property professionals:
-
Audit your current data sources. Identify which satellite, LiDAR, and aerial datasets are already available for your operating geography and which platforms can ingest them.
-
Pilot on a defined portfolio segment. Select 20-50 properties with known risk profiles and run an AI classification workflow. Compare outputs against existing survey records to calibrate accuracy for your specific geography.
-
Establish a validation protocol. Define the confidence score threshold above which AI outputs are accepted without additional ground investigation, and document this protocol for professional indemnity purposes.
-
Engage with insurers early. Present AI monitoring data to insurers during renewal negotiations. Several underwriters now offer premium adjustments for properties with verified continuous monitoring programmes.
-
Stay current with RICS guidance. The professional standards governing AI-assisted assessments are evolving. Practitioners should monitor RICS updates and ensure their terms of engagement reflect the use of automated tools.
The surveyors and risk professionals who build competence in AI terrain tools now will be positioned to deliver faster, more accurate, and more defensible assessments as client and regulatory expectations continue to rise.
References
[1] beaglelabs.ai – https://www.beaglelabs.ai/?utm_source=openai
[2] geovoid – https://geovoid.com/?utm_source=openai
[3] terrasatch – https://www.terrasatch.com/?utm_source=openai
[4] rareearthai – https://rareearthai.org/?utm_source=openai
[5] satelife.ai – https://satelife.ai/?utm_source=openai
[6] Automated Risk Detection – https://www.live-eo.com/product/treeline/automated-risk-detection?utm_source=openai
[7] aeriscan – https://www.aeriscan.com/?utm_source=openai
[8] Artificial Intelligence – https://www.nearmap.com/artificial-intelligence?utm_source=openai
[9] parcel-sense – https://www.parcel-sense.com/?utm_source=openai
[10] slopewise.ai – https://slopewise.ai/?utm_source=openai